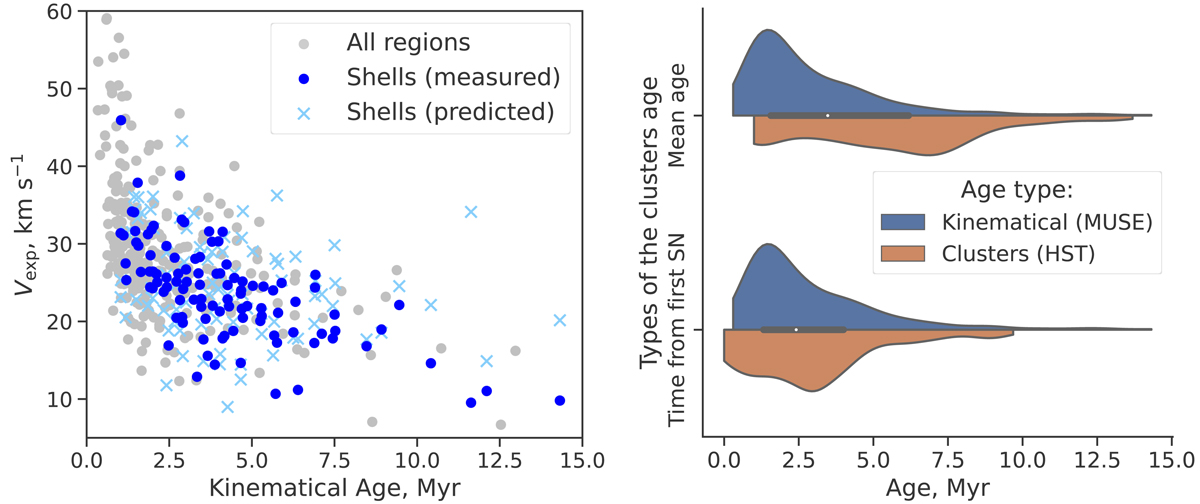
Fig. 11.
Download original image
Kinematic properties of the regions with elevated velocity dispersion. Left panel shows the relation between the estimated expansion velocity (Vexp) and kinematic age of each region (grey points). Blue points correspond to the regions classified as ‘Shells’, and light-blue crosses – to the values of Vexp for that sub-sample predicted from the analytical model (Eq. (9)) based on their estimated kinematic age and the properties of the star clusters. Top histograms in right panel shows the distribution of the kinematic age (blue colour) and the mean age of the clusters (weighted by their total mechanical energy input during the last 10 Myr; orange colour). Orange colour on the bottom histograms considers only clusters older than 4 Myr and corresponds to the time passed since the first SN (assuming it is happening at 4 Myr according to Fig. 6). Only the regions with at least one stellar association or star cluster are shown.
Current usage metrics show cumulative count of Article Views (full-text article views including HTML views, PDF and ePub downloads, according to the available data) and Abstracts Views on Vision4Press platform.
Data correspond to usage on the plateform after 2015. The current usage metrics is available 48-96 hours after online publication and is updated daily on week days.
Initial download of the metrics may take a while.