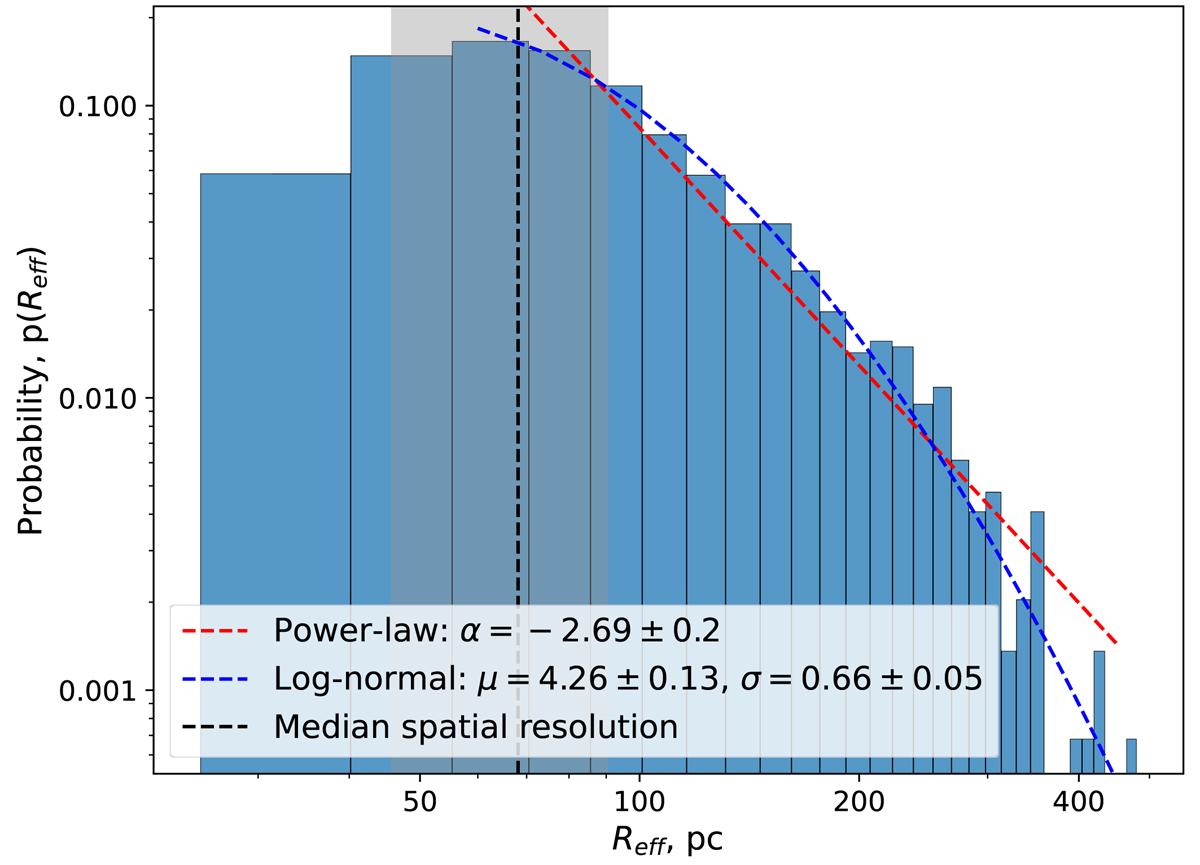
Fig. 10.
Download original image
Distribution of sizes for regions of high Hα velocity dispersion. The red line shows a result of a power-law fit to the data for Reff = 70 − 300 pc. This fit agrees with a power-law approximation for the sizes of superbubbles according to hydrodynamical simulations (α = −2.7 obtained by Nath et al. 2020). The distribution of larger and smaller regions is better approximated by log-normal distribution (the blue line). The dashed black line and the grey area show the median spatial resolution and its standard deviation across our sample.
Current usage metrics show cumulative count of Article Views (full-text article views including HTML views, PDF and ePub downloads, according to the available data) and Abstracts Views on Vision4Press platform.
Data correspond to usage on the plateform after 2015. The current usage metrics is available 48-96 hours after online publication and is updated daily on week days.
Initial download of the metrics may take a while.