Fig. 8.
Download original image
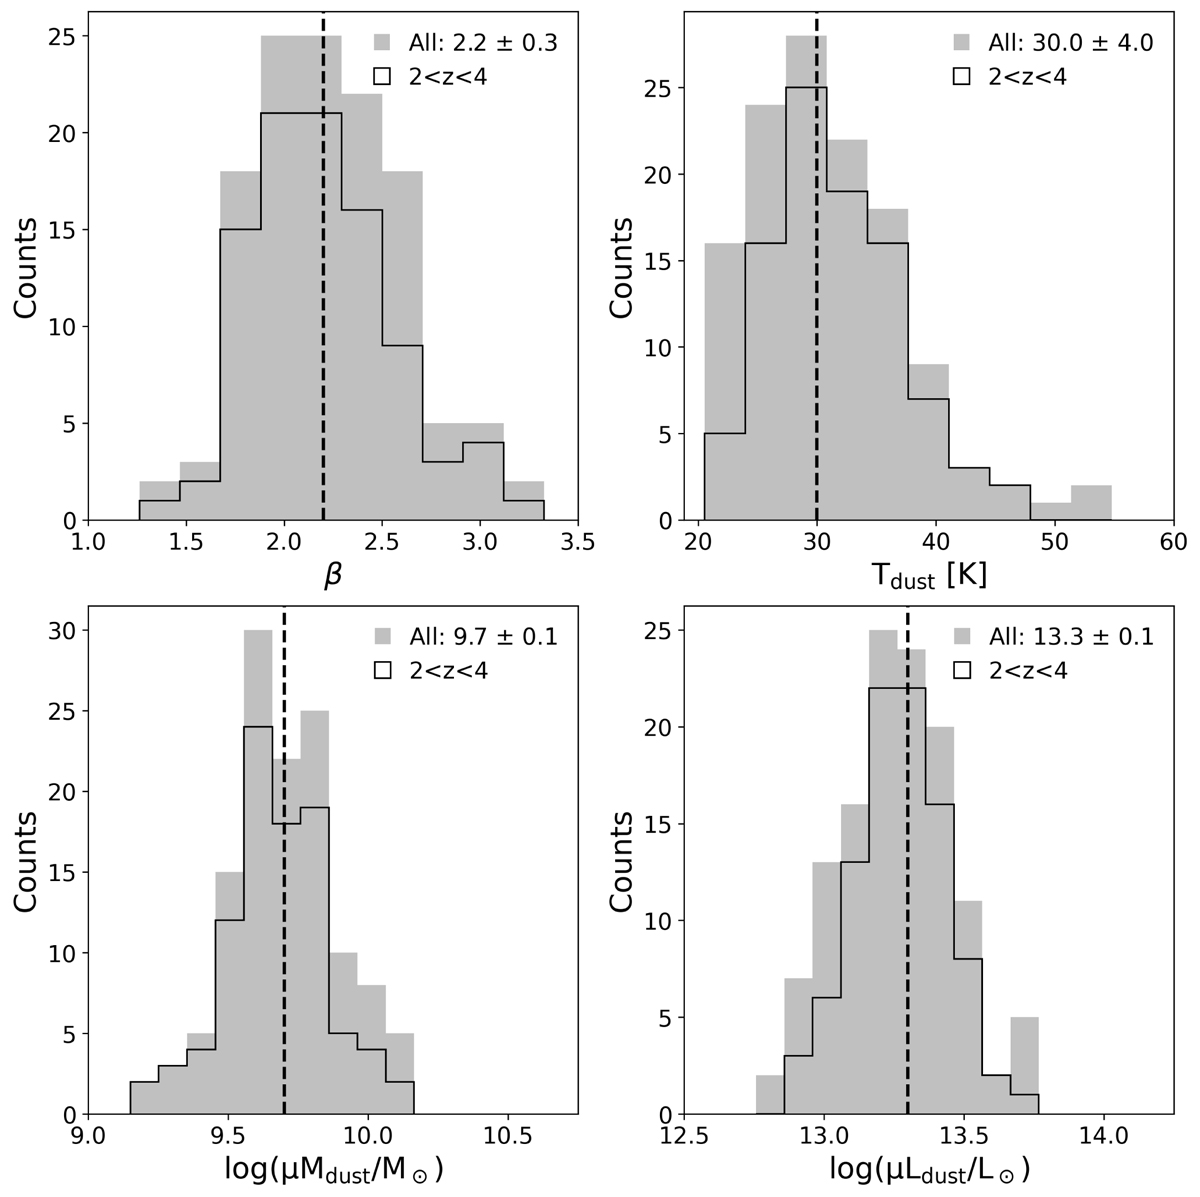
Distribution of the dust properties of the z-GAL sources derived from the MBB shown in gray. The median value of each parameter is plotted with a dashed line whose value is given in the upper right corner of each plot along with the median absolute deviation. The black contour histogram shows the distribution of each parameter within the redshift subset 2 < z < 4.
Current usage metrics show cumulative count of Article Views (full-text article views including HTML views, PDF and ePub downloads, according to the available data) and Abstracts Views on Vision4Press platform.
Data correspond to usage on the plateform after 2015. The current usage metrics is available 48-96 hours after online publication and is updated daily on week days.
Initial download of the metrics may take a while.