Fig. 4.
Download original image
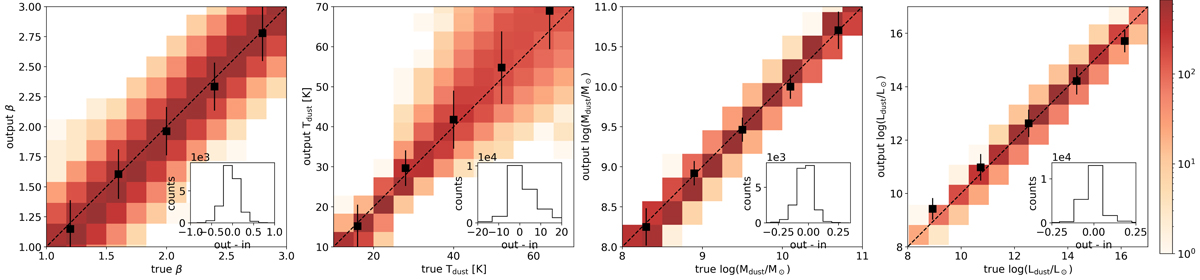
Input (true) vs. output dust properties of the mock-generated catalog of sources. The black line is the identity line and the black dots show the median within the bins and the error bars represent the standard deviation in these bins. The boxes in the lower right corner describe the accuracy of the fitting method when using the optically thin MBB for this mock sample.
Current usage metrics show cumulative count of Article Views (full-text article views including HTML views, PDF and ePub downloads, according to the available data) and Abstracts Views on Vision4Press platform.
Data correspond to usage on the plateform after 2015. The current usage metrics is available 48-96 hours after online publication and is updated daily on week days.
Initial download of the metrics may take a while.