Fig. 3.
Download original image
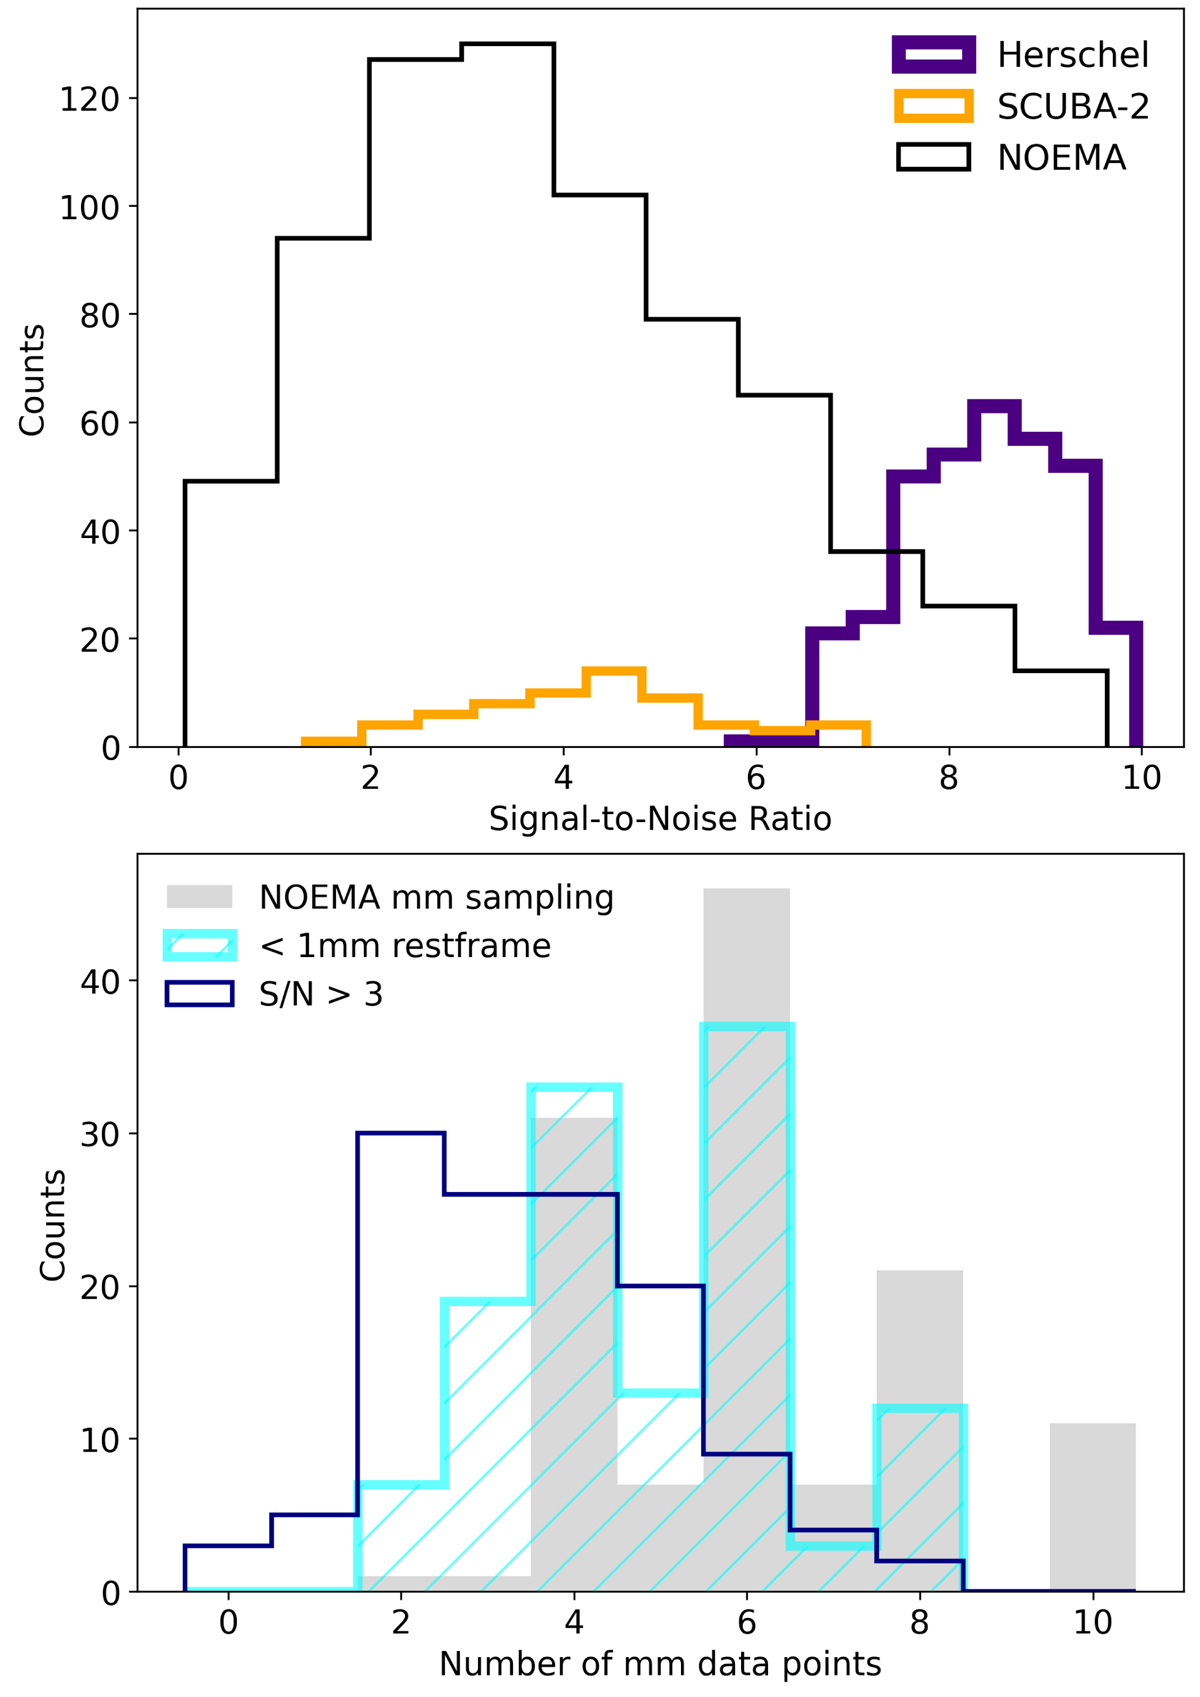
Sampling and S/N of the flux densities of the z-GAL galaxies. Top panel: signal-to-noise ratio of the z-GAL data split into Herschel 250, 350, and 500 μm flux densities shown in indigo, which varies between 6 and 10; SCUBA-2 850 μm flux density, in orange, which varies between 1.5 and 7; and NOEMA 2 and 3 mm flux densities, which varies between 1 and 9, shown in black. Bottom panel: distribution of the number of millimeter flux data points available for each z-GAL source shown in gray; all sources have at least 2, and up to 10, measurements. The cyan histogram shows the number of millimeter measurements used in the fitting procedure (below 1 mm in the rest-frame; see Sect. 3) with a median of 5 data points sampling the Rayleigh-Jeans of the z-GAL sources. The indigo-lined histogram shows the number of data points with signal-to-noise ratio > 3.
Current usage metrics show cumulative count of Article Views (full-text article views including HTML views, PDF and ePub downloads, according to the available data) and Abstracts Views on Vision4Press platform.
Data correspond to usage on the plateform after 2015. The current usage metrics is available 48-96 hours after online publication and is updated daily on week days.
Initial download of the metrics may take a while.