Fig. C.1.
Download original image
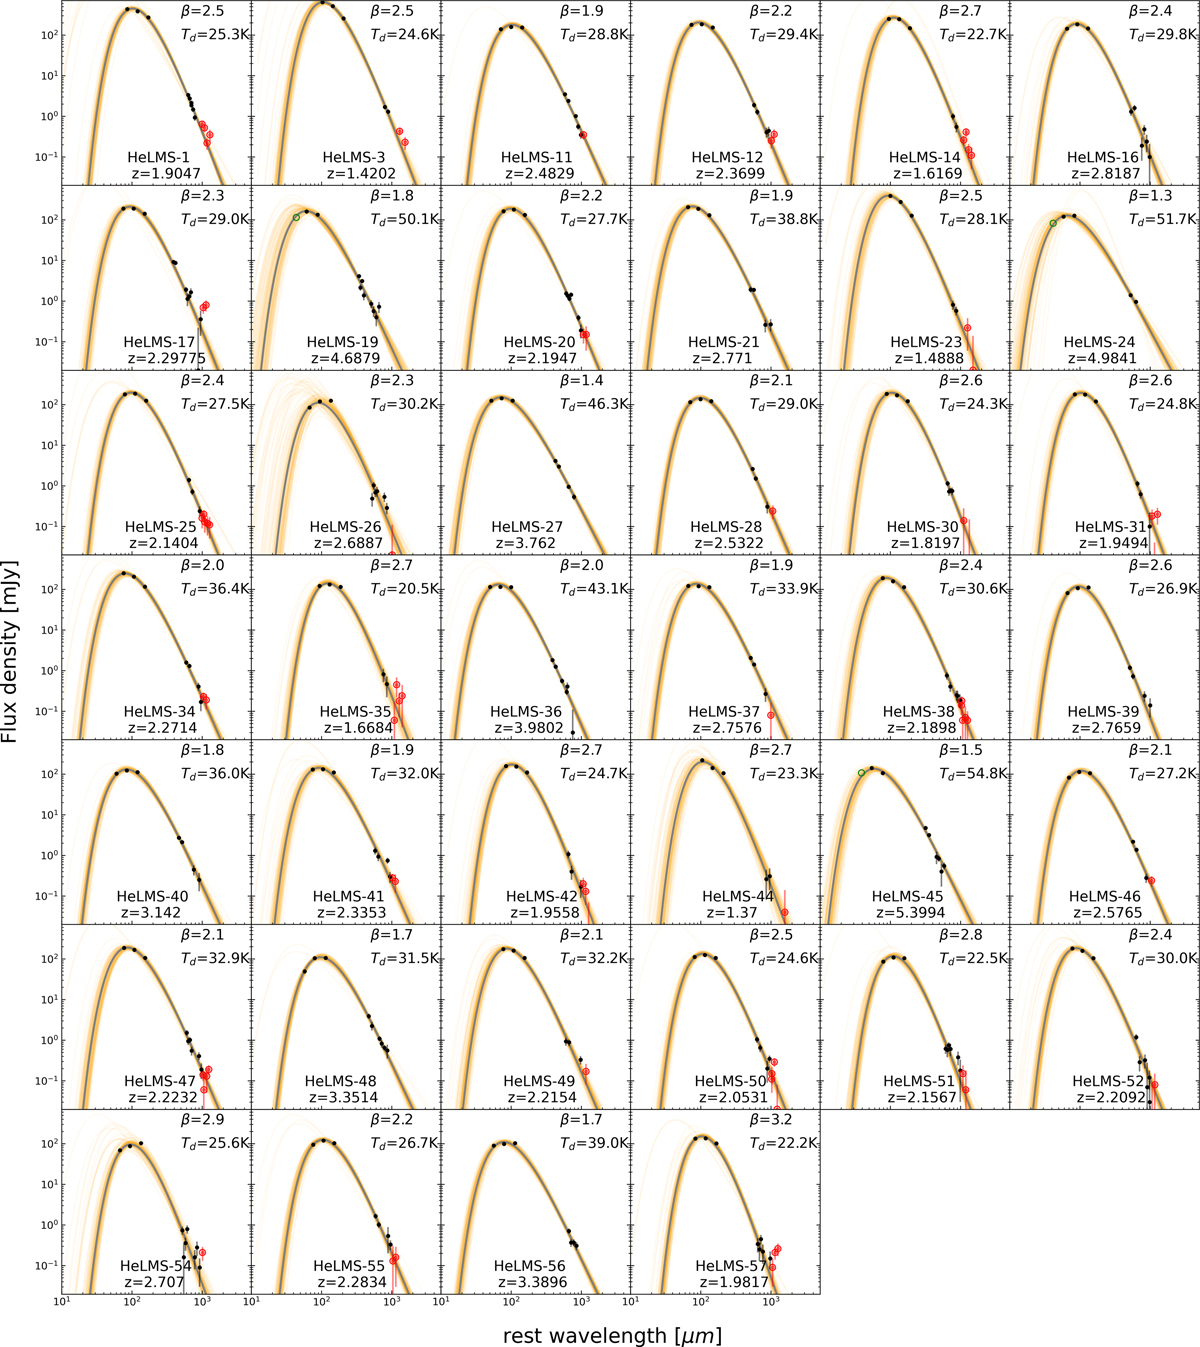
Spectral energy distributions of the HeLMS sources. The observed flux densities that are used in the computation of the dust properties are shown as black dots and the error bars correspond to their 1σ uncertainties. We also plot the millimeter flux densities at which the wavelength is above 1000 μm in rest-frame as open red circles and the flux densities at which the rest-frame wavelength is below 50 μm as open green circles. The solid gray line is the MBB best fit and the orange lines are the output sampling of 100 random walks from the EMCEE output. The names of the sources and their spectroscopic redshifts are given in the lower right corner of each panel.
Current usage metrics show cumulative count of Article Views (full-text article views including HTML views, PDF and ePub downloads, according to the available data) and Abstracts Views on Vision4Press platform.
Data correspond to usage on the plateform after 2015. The current usage metrics is available 48-96 hours after online publication and is updated daily on week days.
Initial download of the metrics may take a while.