Fig. 19.
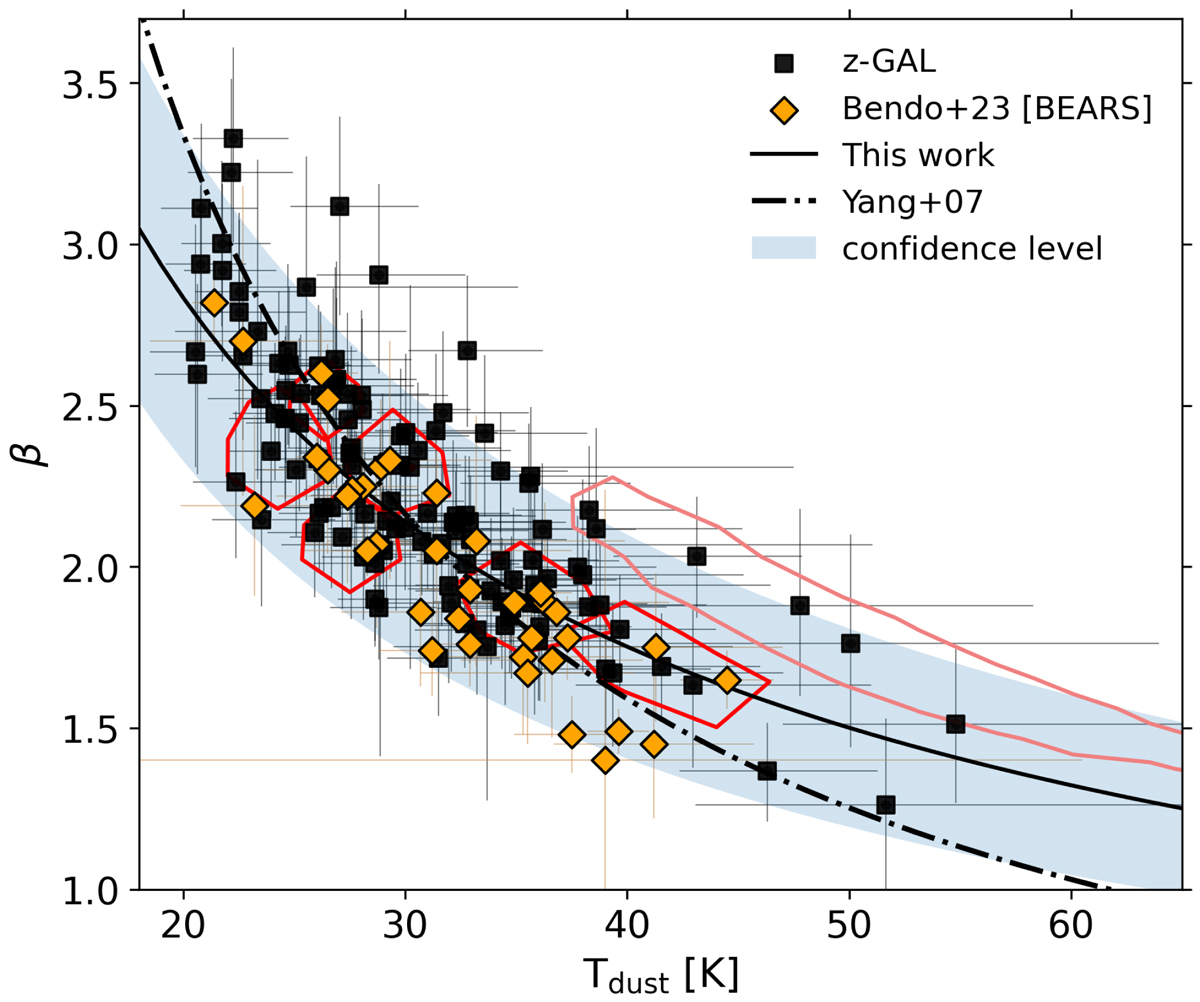
Download original image
β − Tdust distribution for the z-GAL sources (black squares) compared to the BEARS sources (orange diamonds; Bendo et al. 2023). The solid black line is the fitted relation we find for the z-GAL sources with α = 0.69 ± 0.04 (see Sect. 6.4) and the shaded region is the confidence level. We over-plot the trend found by Yang & Phillips (2007) for local LIRGs in black dashed line. The 1σ level distribution of the MCMC chains is represented by the red contours for a few sources, that demonstrate a high level constraint. The lighter pink contour demonstrates one of the few cases where the 1σ level shows large degeneracy.
Current usage metrics show cumulative count of Article Views (full-text article views including HTML views, PDF and ePub downloads, according to the available data) and Abstracts Views on Vision4Press platform.
Data correspond to usage on the plateform after 2015. The current usage metrics is available 48-96 hours after online publication and is updated daily on week days.
Initial download of the metrics may take a while.