Fig. 18.
Download original image
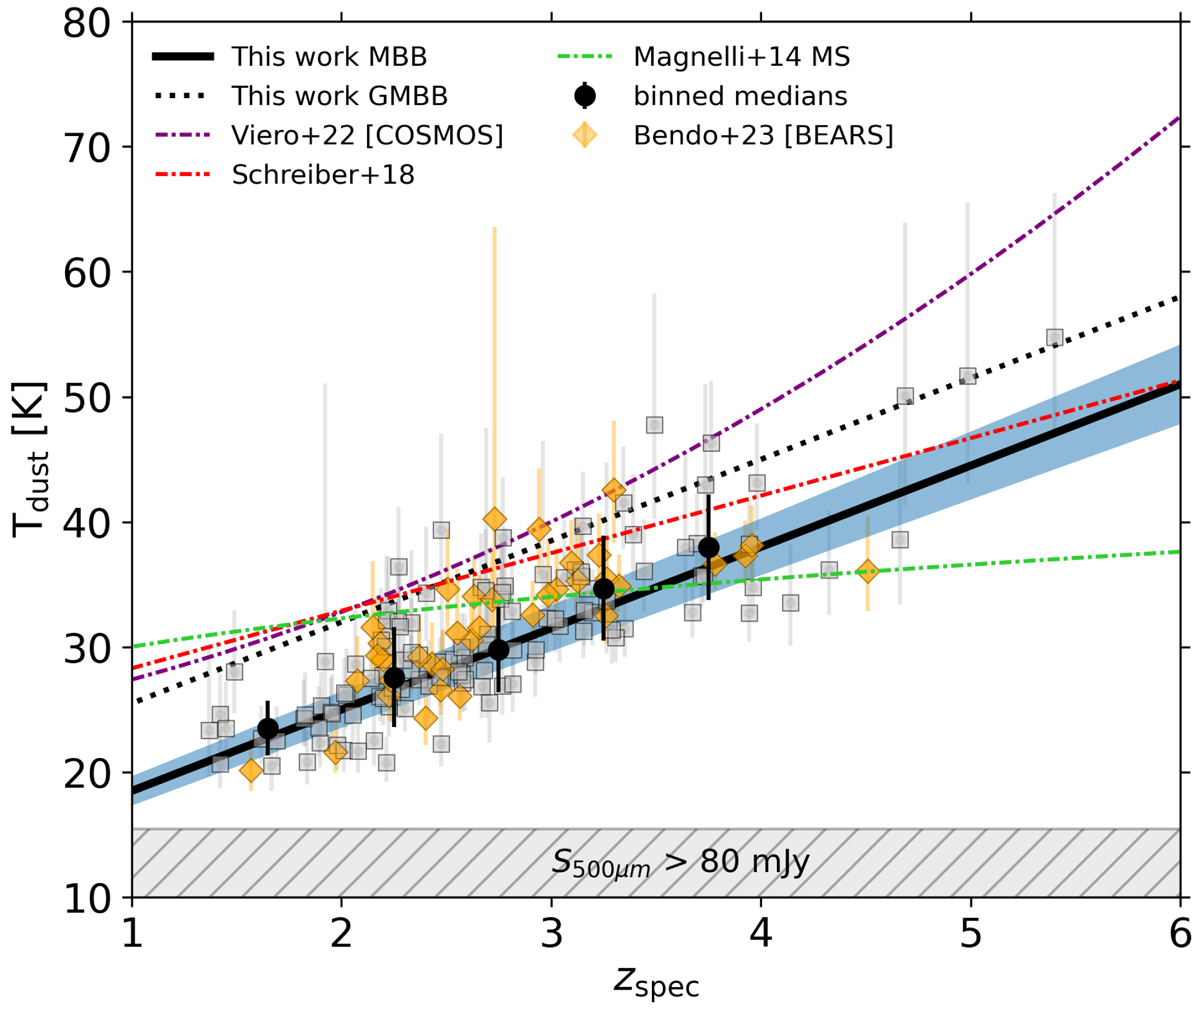
z-GAL MBB dust temperatures as a function of redshift shown in gray squares with their respective uncertainties. Best-fit slope estimated for the MBB is plotted with a solid black line and for GMBB with a dotted black line with the confidence interval shaded in blue. The median binned temperatures are plotted in black circles up to redshift z = 4 with a bin size of Δz = 0.5. The selection effect is shown with a gray shaded region. For comparison, we over-plot the BEARS-derived MBB dust temperatures by Bendo et al. (2023) shown as orange diamonds. Evolutionary trends from the literature are also plotted in purple (Viero et al. 2022), in red (Schreiber et al. 2018, extrapolated to z = 6), and in green (Magnelli et al. 2014, extrapolated to z = 6).
Current usage metrics show cumulative count of Article Views (full-text article views including HTML views, PDF and ePub downloads, according to the available data) and Abstracts Views on Vision4Press platform.
Data correspond to usage on the plateform after 2015. The current usage metrics is available 48-96 hours after online publication and is updated daily on week days.
Initial download of the metrics may take a while.