Fig. 16.
Download original image
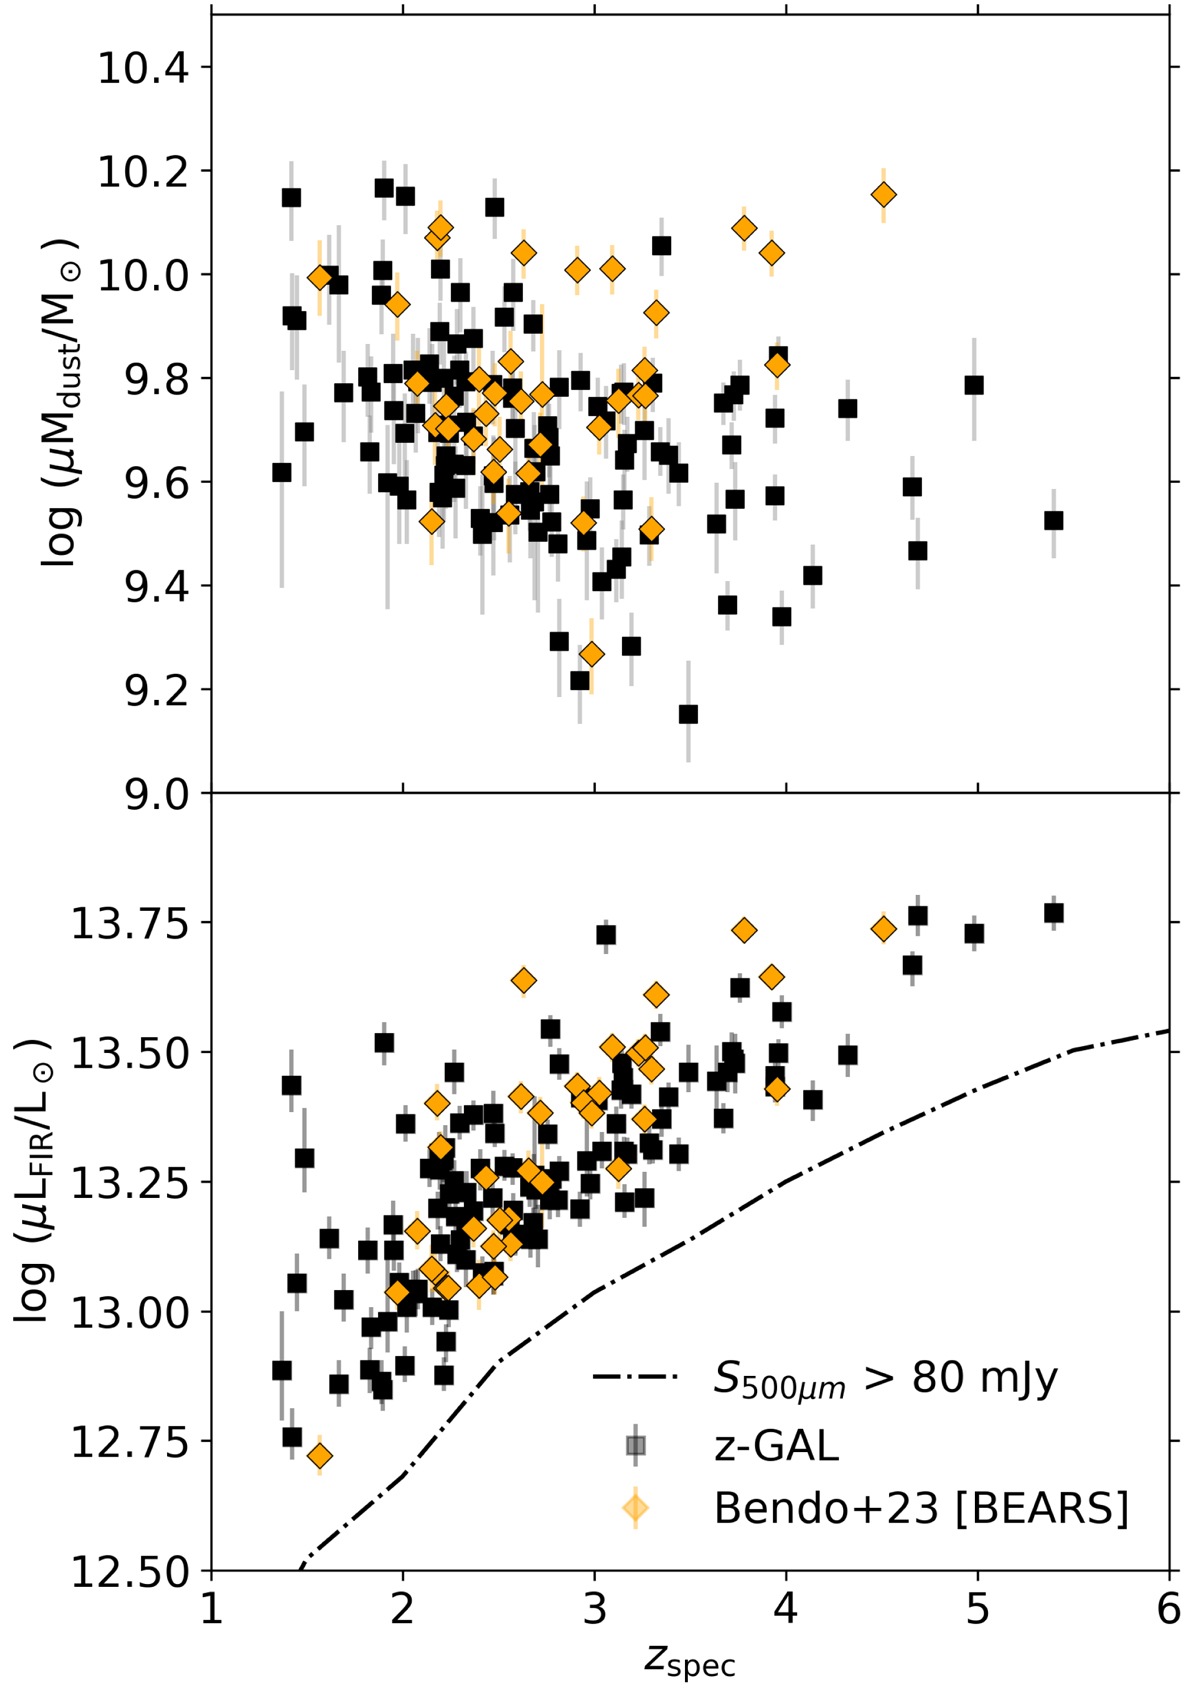
Evolution of z-GAL apparent dust mass (upper panel) and apparent FIR luminosity (lower panel) with redshift for the optically thin MBB, shown in black squares. The BEARS sample (Bendo et al. 2023) is over-plotted in orange diamonds. In the lower panel, the black dashed line shows the lower limit resulting from the 500 μm flux density selection.
Current usage metrics show cumulative count of Article Views (full-text article views including HTML views, PDF and ePub downloads, according to the available data) and Abstracts Views on Vision4Press platform.
Data correspond to usage on the plateform after 2015. The current usage metrics is available 48-96 hours after online publication and is updated daily on week days.
Initial download of the metrics may take a while.