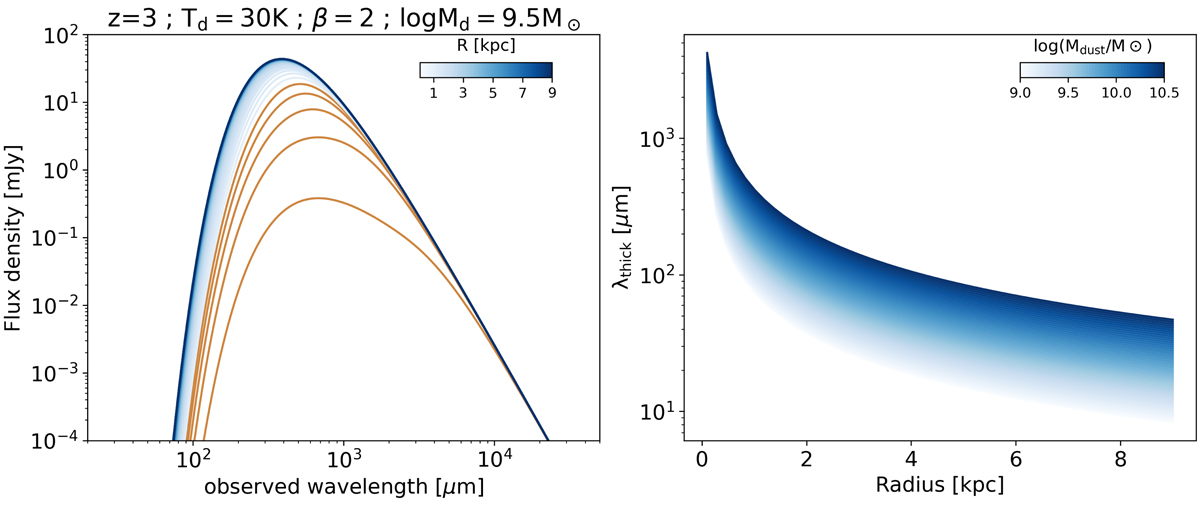
Fig. 12.
Download original image
Effect of the source-size variation on SED fitting. Left: Effect of source size variation on the SED of a galaxy. Orange indicates the variation when the size R < 1 kpc, and a gradient of blues indicates the variation when R > 1 kpc. On the right side, we plot λthick (wavelength at which optical depth is unity) versus source size (R), color coded according to dust mass. These two figures show that for source sizes R < 1 kpc, there is a large effect on the peak of the SED, where the medium is optically thick, reaching higher values of λthick.
Current usage metrics show cumulative count of Article Views (full-text article views including HTML views, PDF and ePub downloads, according to the available data) and Abstracts Views on Vision4Press platform.
Data correspond to usage on the plateform after 2015. The current usage metrics is available 48-96 hours after online publication and is updated daily on week days.
Initial download of the metrics may take a while.