Fig. 8.
Download original image
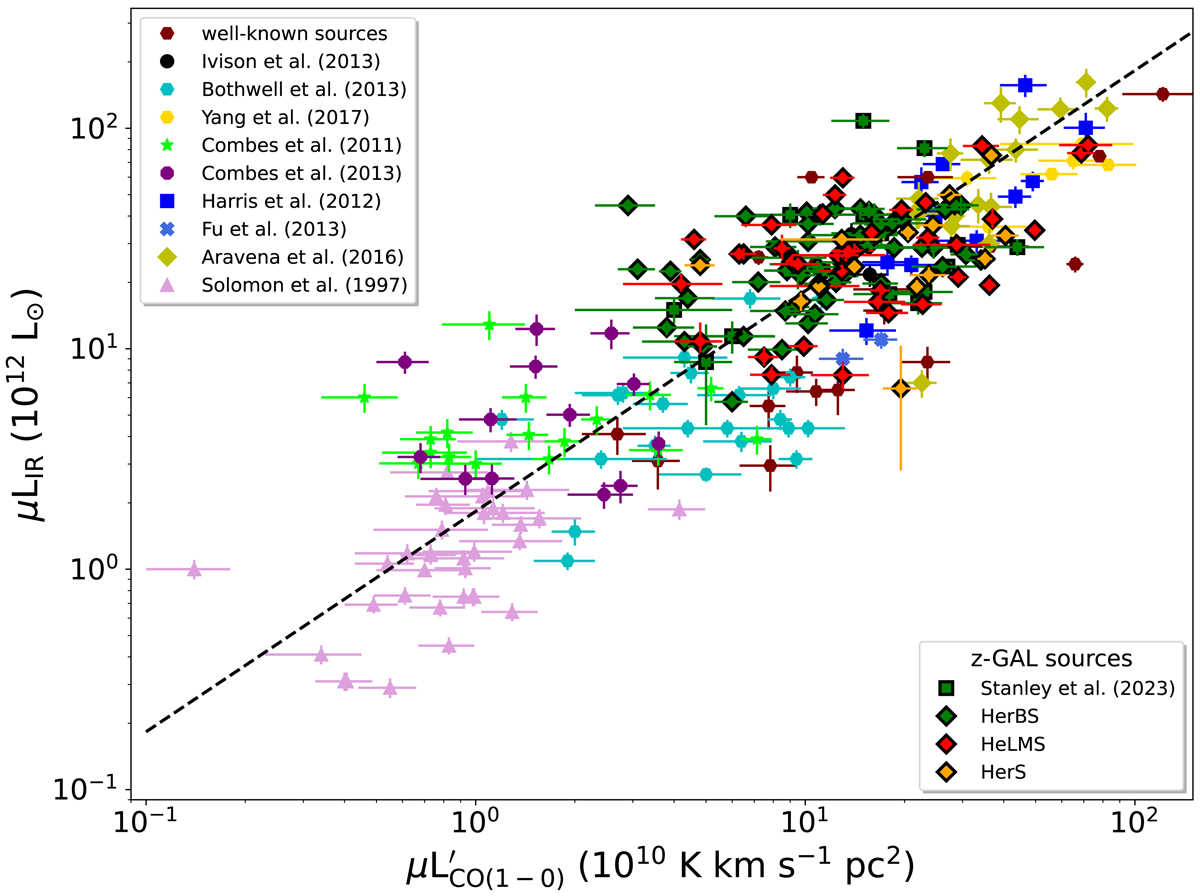
Infrared luminosity (LIR; 8–1000 μm) as a function of ![]() for the z-GAL sample, including the sources from the Pilot Programme (Neri et al. 2020; Stanley et al. 2023). The sources are identified using the same symbols as in Fig. 7. The infrared luminosities are derived from Paper II (Sect. 4.2). For comparison, we also plot high-z lensed and unlensed galaxies, as well as local ultra-luminous infrared galaxies (ULIRGs) from the literature (also shown in Fig. 7) with references and corresponding symbols given in the upper left panel. No correction for amplification was applied to the 12CO and infrared luminosities. The dashed line shows the linear relationship between LIR and
for the z-GAL sample, including the sources from the Pilot Programme (Neri et al. 2020; Stanley et al. 2023). The sources are identified using the same symbols as in Fig. 7. The infrared luminosities are derived from Paper II (Sect. 4.2). For comparison, we also plot high-z lensed and unlensed galaxies, as well as local ultra-luminous infrared galaxies (ULIRGs) from the literature (also shown in Fig. 7) with references and corresponding symbols given in the upper left panel. No correction for amplification was applied to the 12CO and infrared luminosities. The dashed line shows the linear relationship between LIR and ![]() for a gas depletion timescale of τdep = 0.2 Gyr (Paper III).
for a gas depletion timescale of τdep = 0.2 Gyr (Paper III).
Current usage metrics show cumulative count of Article Views (full-text article views including HTML views, PDF and ePub downloads, according to the available data) and Abstracts Views on Vision4Press platform.
Data correspond to usage on the plateform after 2015. The current usage metrics is available 48-96 hours after online publication and is updated daily on week days.
Initial download of the metrics may take a while.