Fig. 7.
Download original image
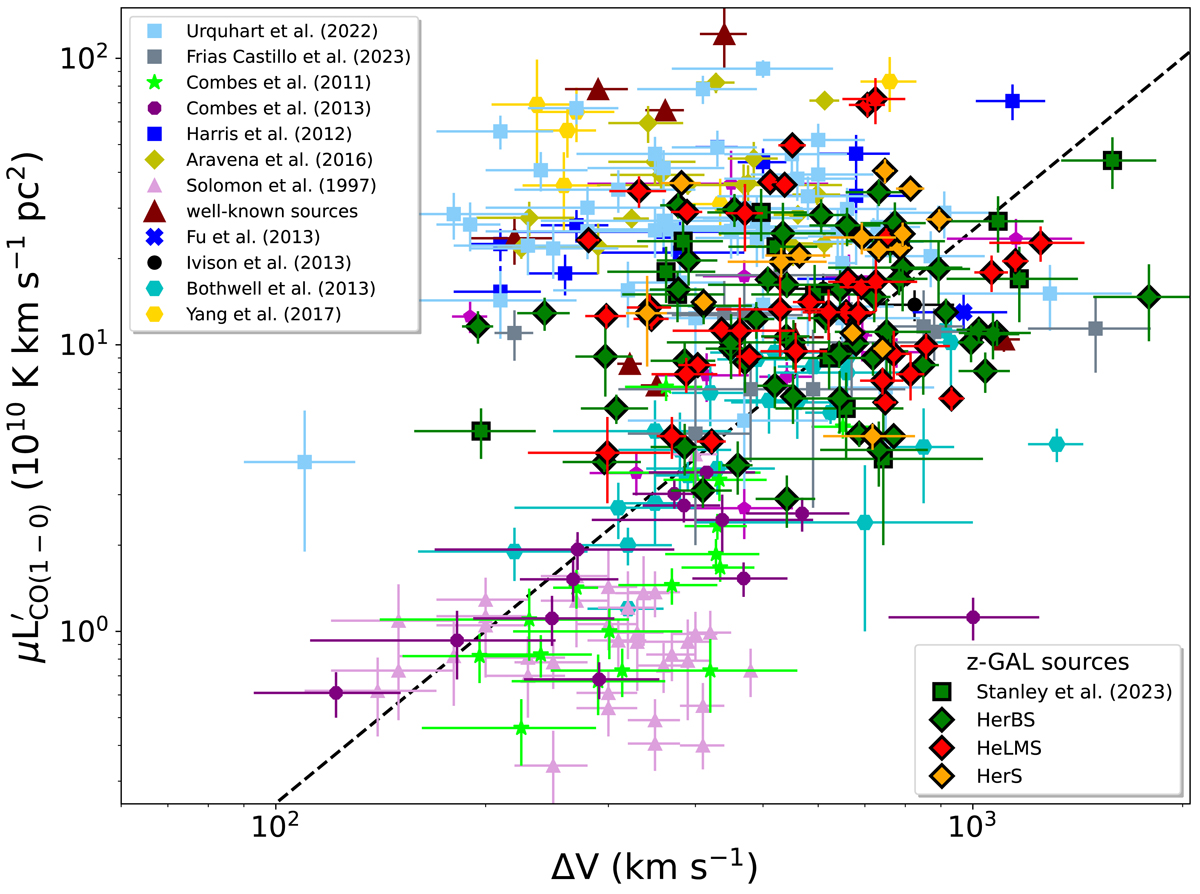
12CO luminosity (![]() plotted against the linewidth (ΔV) of the 12CO emission line for the z-GAL sources. The HerS, HeLMS and HerBS samples are identified with orange, red and green diamond shaped symbols, respectively, where the values for
plotted against the linewidth (ΔV) of the 12CO emission line for the z-GAL sources. The HerS, HeLMS and HerBS samples are identified with orange, red and green diamond shaped symbols, respectively, where the values for ![]() are from Paper III. The sources of the Pilot Programme from Neri et al. (2020) are shown as green squares with the 12CO(1–0) luminosity values from Stanley et al. (2023). The z-GAL sample is compared to high-z lensed and unlensed galaxy samples (Harris et al. 2012; Bothwell et al. 2013; Yang et al. 2017; Urquhart et al. 2022; Frias Castillo et al. 2023), individual galaxies including the two binary hyper-luminous systems H-ATLAS J084933 at z = 2.41 (Ivison et al. 2013) and HXMM01 at z = 2.308 (Fu et al. 2013), well-known high-z sources, both lensed (IRAS F10214, Eyelash, Cloverleaf, APM 08279 and the Cosmic Eyebrow) and unlensed (BR1202N and S, and BR1335), from Carilli & Walter (2013, and references therein) and Dannerbauer et al. (2019), and local ultra-luminous infrared galaxies (ULIRGs; Combes et al. 2011, 2013; Solomon et al. 1997) with corresponding symbols as indicated in the upper left panel. The sources of Harris et al. (2012) are the ones reported in Table 1 of that paper, except for H-ATLAS J084933 where we used the follow-up measurements of Ivison et al. (2013). No correction for amplification was applied to the 12CO luminosities. With the exception of the sources of this paper and the sources selected from Yang et al. (2017), Bothwell et al. (2013) and Urquhart et al. (2022), all the other sources used in this plot have been measured in 12CO(1–0) or in 12CO(2–1). Corrections for excitation were applied for sources for which only 12CO transitions higher than J = 2–1 are available, using the ratios listed in Carilli & Walter (2013). The dashed line shows the best-fitting power-law fit derived from the data for the unlensed DSFGs,
are from Paper III. The sources of the Pilot Programme from Neri et al. (2020) are shown as green squares with the 12CO(1–0) luminosity values from Stanley et al. (2023). The z-GAL sample is compared to high-z lensed and unlensed galaxy samples (Harris et al. 2012; Bothwell et al. 2013; Yang et al. 2017; Urquhart et al. 2022; Frias Castillo et al. 2023), individual galaxies including the two binary hyper-luminous systems H-ATLAS J084933 at z = 2.41 (Ivison et al. 2013) and HXMM01 at z = 2.308 (Fu et al. 2013), well-known high-z sources, both lensed (IRAS F10214, Eyelash, Cloverleaf, APM 08279 and the Cosmic Eyebrow) and unlensed (BR1202N and S, and BR1335), from Carilli & Walter (2013, and references therein) and Dannerbauer et al. (2019), and local ultra-luminous infrared galaxies (ULIRGs; Combes et al. 2011, 2013; Solomon et al. 1997) with corresponding symbols as indicated in the upper left panel. The sources of Harris et al. (2012) are the ones reported in Table 1 of that paper, except for H-ATLAS J084933 where we used the follow-up measurements of Ivison et al. (2013). No correction for amplification was applied to the 12CO luminosities. With the exception of the sources of this paper and the sources selected from Yang et al. (2017), Bothwell et al. (2013) and Urquhart et al. (2022), all the other sources used in this plot have been measured in 12CO(1–0) or in 12CO(2–1). Corrections for excitation were applied for sources for which only 12CO transitions higher than J = 2–1 are available, using the ratios listed in Carilli & Walter (2013). The dashed line shows the best-fitting power-law fit derived from the data for the unlensed DSFGs, ![]() = 105.4 × ΔV2 (e.g., Bothwell et al. 2013; Zavala et al. 2015).
= 105.4 × ΔV2 (e.g., Bothwell et al. 2013; Zavala et al. 2015).
Current usage metrics show cumulative count of Article Views (full-text article views including HTML views, PDF and ePub downloads, according to the available data) and Abstracts Views on Vision4Press platform.
Data correspond to usage on the plateform after 2015. The current usage metrics is available 48-96 hours after online publication and is updated daily on week days.
Initial download of the metrics may take a while.