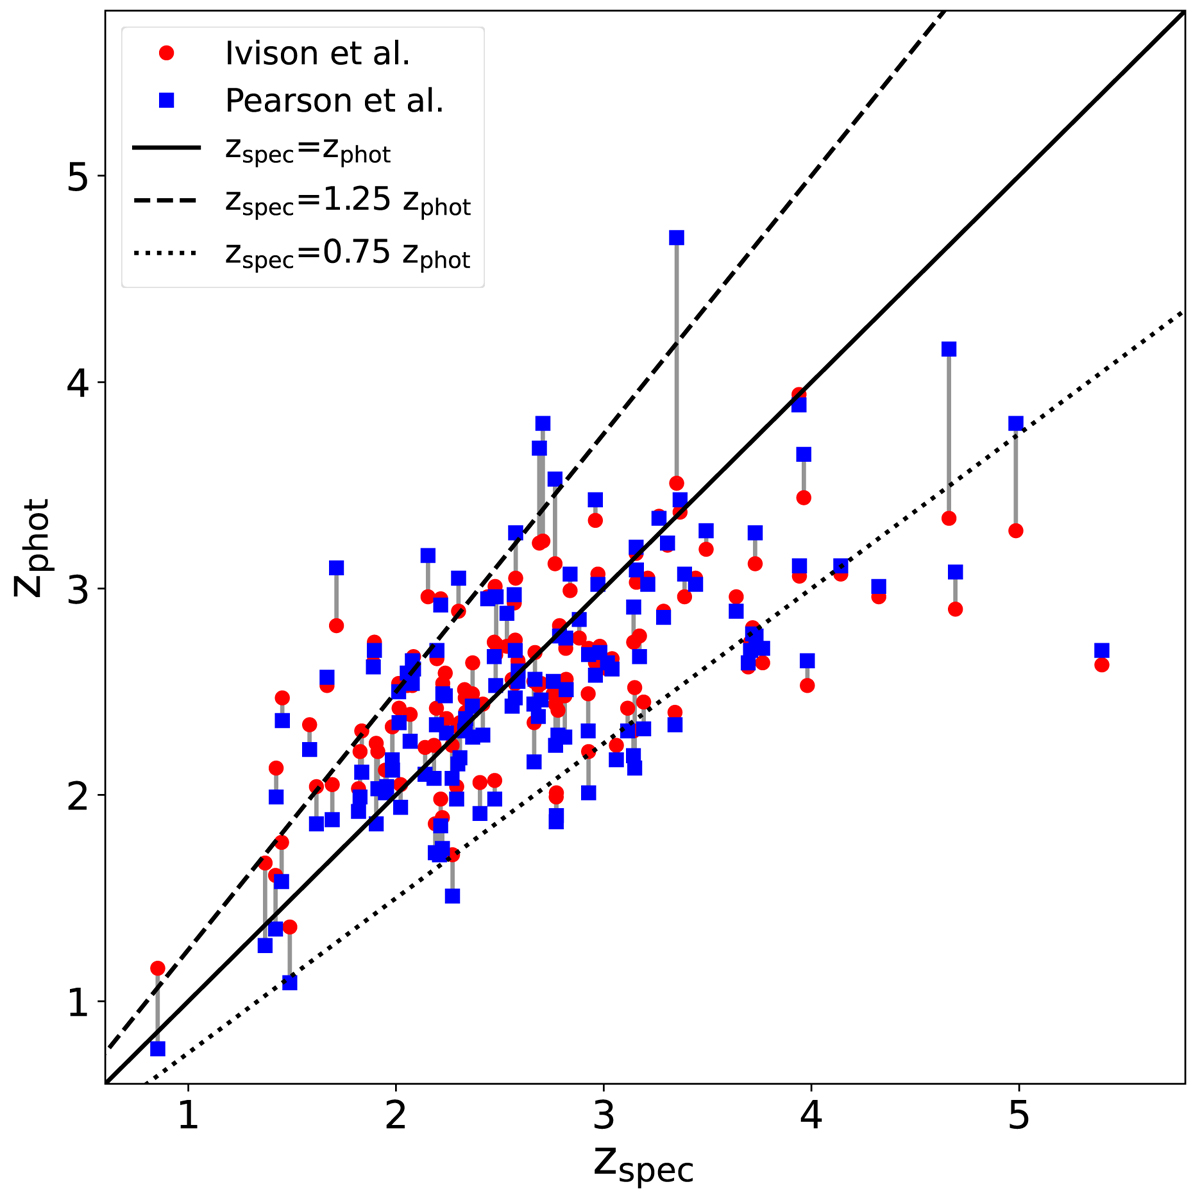
Fig. 6.
Download original image
Comparison of the spectroscopic redshifts of the sources in the z-GAL sample that are single and multiple (where each source has a similar redshift) with the photometric redshifts derived using the methods of Ivison et al. (2016) and Pearson et al. (2013) – blue and red symbols, respectively (as listed in Tables A.6–A.8 and A.1–A.3, respectively). For each source, the two photometric redshift values are linked by a grey vertical line positioned at the spectroscopic redshift value. The solid line shows where the photometric and spectroscopic reshifts are equal and the dashed lines indicate the ±25% deviations. The significant spread here displayed is consistent with previous findings (e.g., Ivison et al. 2016; Reuter et al. 2020; Urquhart et al. 2022) and demonstrates that photometric redshifts, based on Herschel and, when available, SCUBA-2 850 μm continuum flux densities, are only indicative.
Current usage metrics show cumulative count of Article Views (full-text article views including HTML views, PDF and ePub downloads, according to the available data) and Abstracts Views on Vision4Press platform.
Data correspond to usage on the plateform after 2015. The current usage metrics is available 48-96 hours after online publication and is updated daily on week days.
Initial download of the metrics may take a while.