Fig. 4.
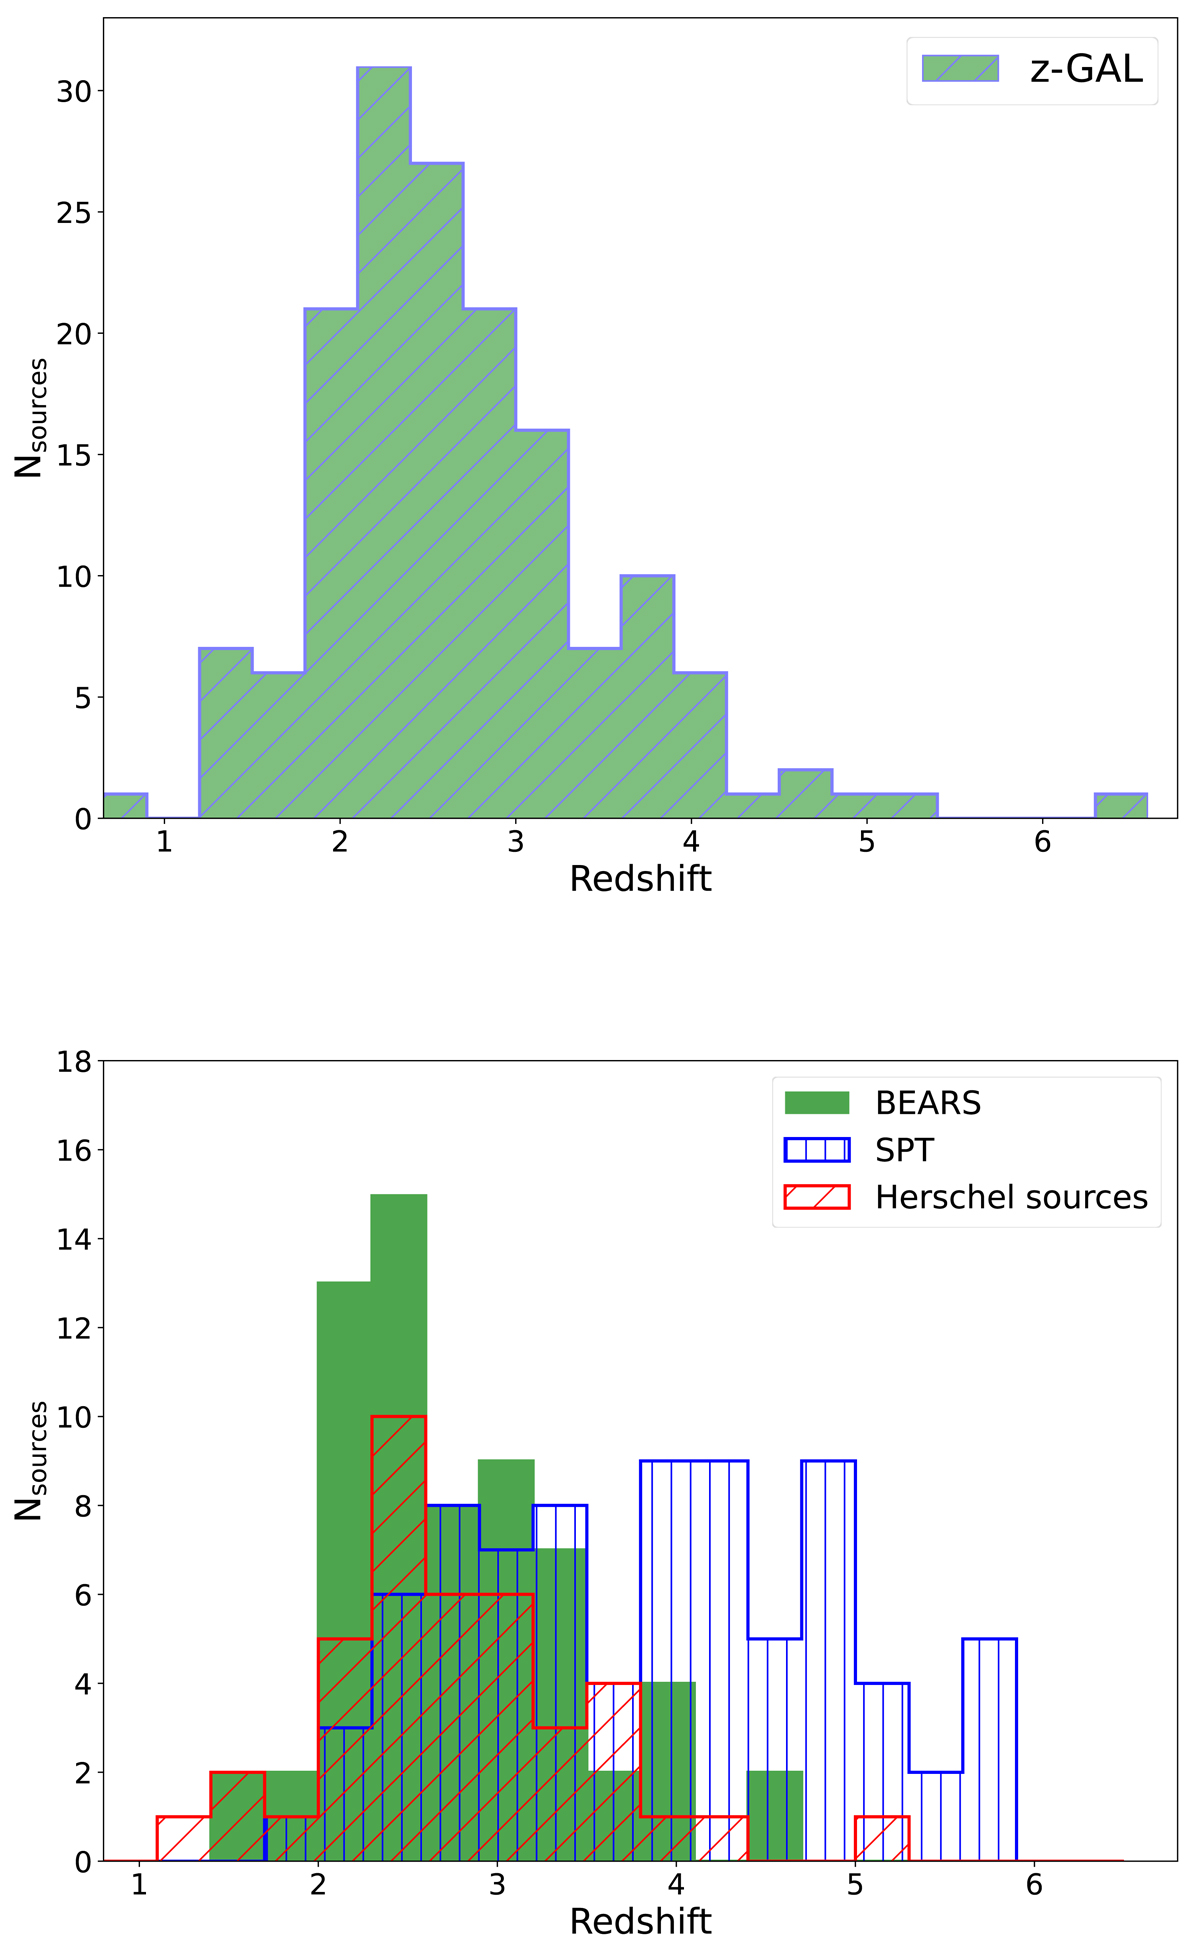
Download original image
Spectroscopic redshift distribution of the z-GAL survey compared to other high-z galaxy samples. Upper panel: Spectroscopic redshift distribution for the 165 individual sources identified in the fields of the 137 bright Herschel-selected galaxies of the z-GAL sample and the Pilot Programme (Neri et al. 2020). All the sources with robust spectroscopic redshifts were detected in at least two emission lines, mostly from CO (Tables A.6–A.8). The spectroscopic redshifts are in the range 0.8 < z < 6.5 with a median value of z = 2.56 ± 0.10. Bottom panel: Spectroscopic redshift distribution of the SPT sample (Reuter et al. 2020), the BEARS sample (Urquhart et al. 2022), and the Herschel sources for which zspec values are listed in Bakx et al. (2018) and Nayyeri et al. (2016) with updates provided in Table A.5.
Current usage metrics show cumulative count of Article Views (full-text article views including HTML views, PDF and ePub downloads, according to the available data) and Abstracts Views on Vision4Press platform.
Data correspond to usage on the plateform after 2015. The current usage metrics is available 48-96 hours after online publication and is updated daily on week days.
Initial download of the metrics may take a while.