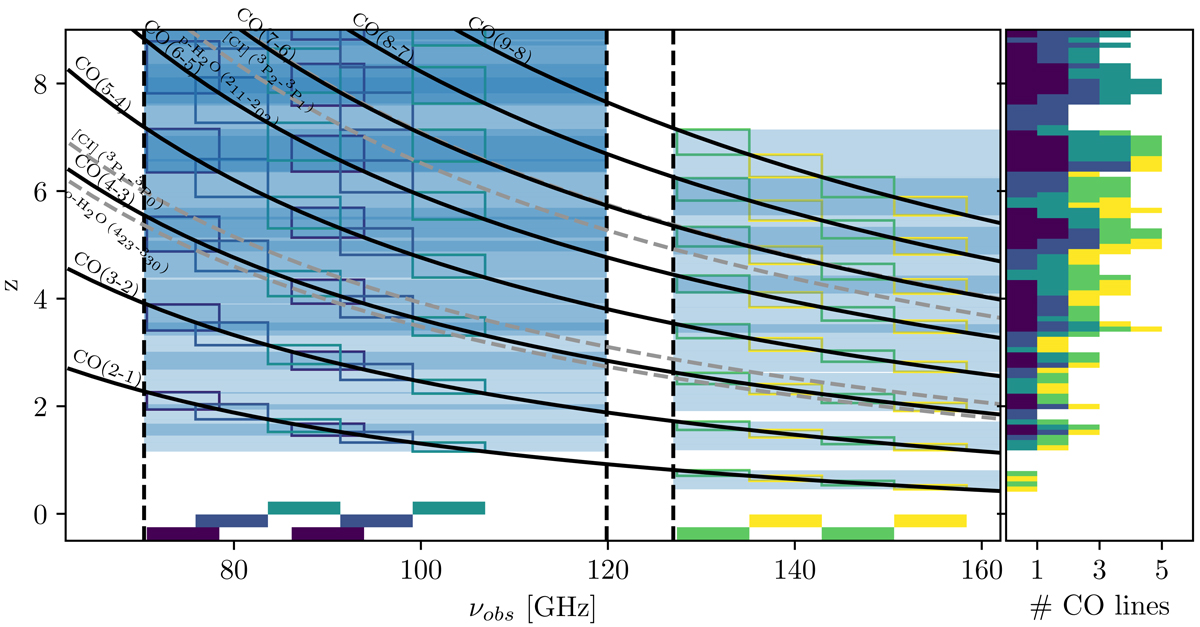
Fig. 3.
Download original image
Spectral coverage of all the molecular and atomic lines searched for in the z-GAL survey as a function of redshift in the 3 and 2 mm atmospheric windows covering the frequency ranges 70.689–106.868 GHz and 127.377–158.380 GHz. The boxes at the bottom show the LSB and USB frequency settings used in the z-GAL Large Programme for the 3-mm band (blue and dark green, respectively) and the 2-mm band (light green and yellow, respectively); those that were selected for the additional observations in the 3-mm band are highlighted in indigo (the set-up at 1 mm used for HeLMS-17 is not displayed – see text for further details). The lines detected in the z-GAL survey include the following: the 12CO emission lines (solid black) from J = 2–1 to 8–7; the [C I] (3P1–3P0) and [C I] (3P2–3P1) fine-structure lines (492 and 809 GHz rest frequencies, respectively, shown as grey dotted lines); and two water transitions, namely, the ortho-H2O (423–330) and para-H2O (211–202) (rest frequencies at 448.001 and 752.033 GHz, respectively, also shown as grey dotted lines). To enhance readability, the right panel exclusively displays the 12CO emission lines that can be detected for a given redshift in each of the frequency settings (identified with their corresponding colour). The 2 mm frequency windows were selected to optimally cover the range of spectroscopic redshifts based on the 3 mm observations. The dark blue zones identify the redshift ranges where at least two emission lines are detected at 3 or 2 mm, while the light blue zones indicate the redshift ranges where only one line is present. The wide frequency coverage enabled by NOEMA enables the detection of at least one emission line in each receiver band, except for a few small redshift gaps (further details are provided in Sect. 2.2).
Current usage metrics show cumulative count of Article Views (full-text article views including HTML views, PDF and ePub downloads, according to the available data) and Abstracts Views on Vision4Press platform.
Data correspond to usage on the plateform after 2015. The current usage metrics is available 48-96 hours after online publication and is updated daily on week days.
Initial download of the metrics may take a while.