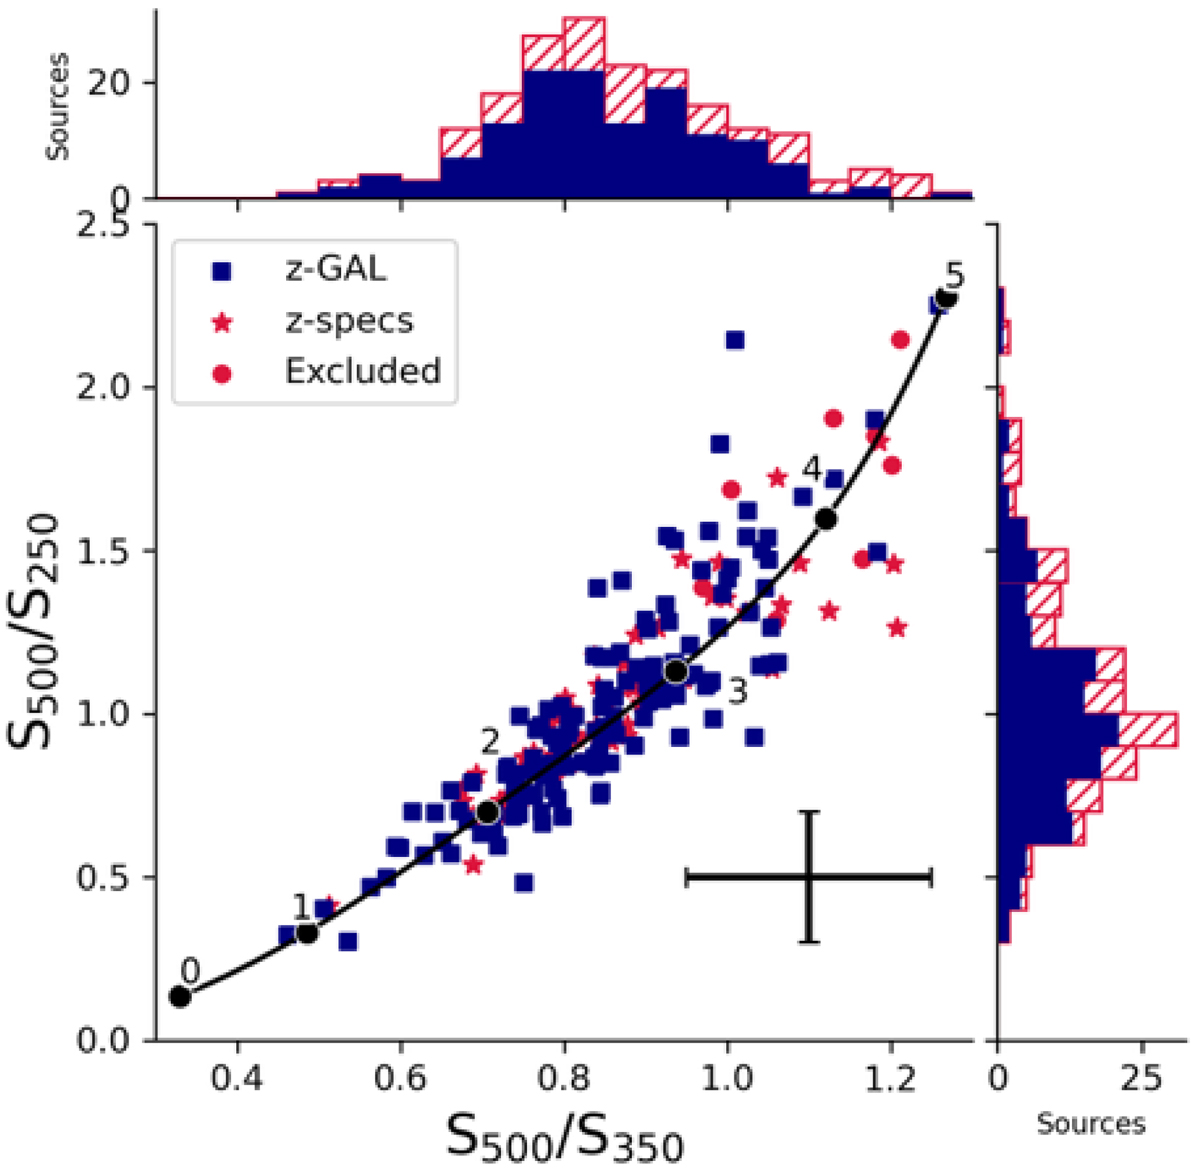
Fig. 2.
Download original image
Herschel/SPIRE colour-colour plot (S500 μm/S250 μm vs. S500 μm/S350 μm) for the z-GAL and Pilot Programme sources (shown as blue squares). Typical uncertainties on the colours are shown in the bottom right corner of the figure. The sources listed in Bakx et al. (2018) and Nayyeri et al. (2016) with spectroscopic redshifts (labelled ‘z-spec’ and listed in Table A.5) are included for comparison and indicated with a red star. The sources that were excluded from the z-GAL selection (labelled “Excluded”) are indicated with a red dot (see Table A.4). The side histograms display the distribution of the values as a function of the number of sources. The overlaid curve shows the redshift track expected for a galaxy with a spectrum energy distribution comparable to the Cosmic Eyelash galaxy; the photometric redshifts are indicated along the curve (see Ivison et al. 2016).
Current usage metrics show cumulative count of Article Views (full-text article views including HTML views, PDF and ePub downloads, according to the available data) and Abstracts Views on Vision4Press platform.
Data correspond to usage on the plateform after 2015. The current usage metrics is available 48-96 hours after online publication and is updated daily on week days.
Initial download of the metrics may take a while.