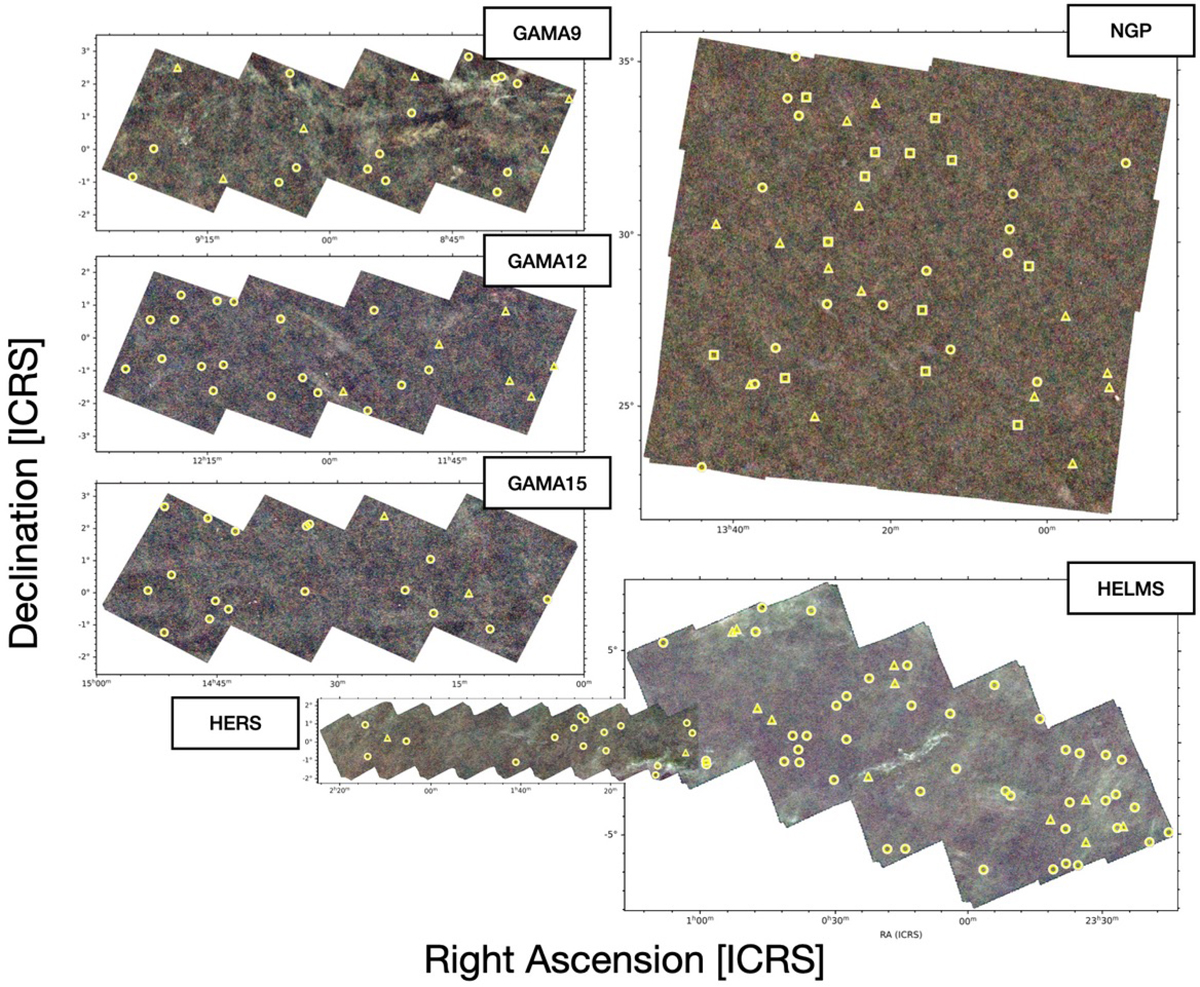
Fig. 1.
Download original image
Herschel/SPIRE colour maps of the H-ATLAS (GAMA9, GAMA12, GAMA15, and NGP), HeLMS and HerS fields with the positions of the 137 sources that were observed with NOEMA in the z-GAL project and the Pilot Programme (Neri et al. 2020), highlighted with yellow circles and squares, respectively. The yellow triangles indicate the sources for which spectroscopic redshifts were already available (see Table A.5). The maps display the distribution of the z-GAL sources across the sky and show the proximity of some of the sources that enabled for them to be grouped together during the NOEMA observations, resulting in a more efficient use of telescope time (Sect. 2.2).
Current usage metrics show cumulative count of Article Views (full-text article views including HTML views, PDF and ePub downloads, according to the available data) and Abstracts Views on Vision4Press platform.
Data correspond to usage on the plateform after 2015. The current usage metrics is available 48-96 hours after online publication and is updated daily on week days.
Initial download of the metrics may take a while.