Open Access
Fig. 9.
Download original image
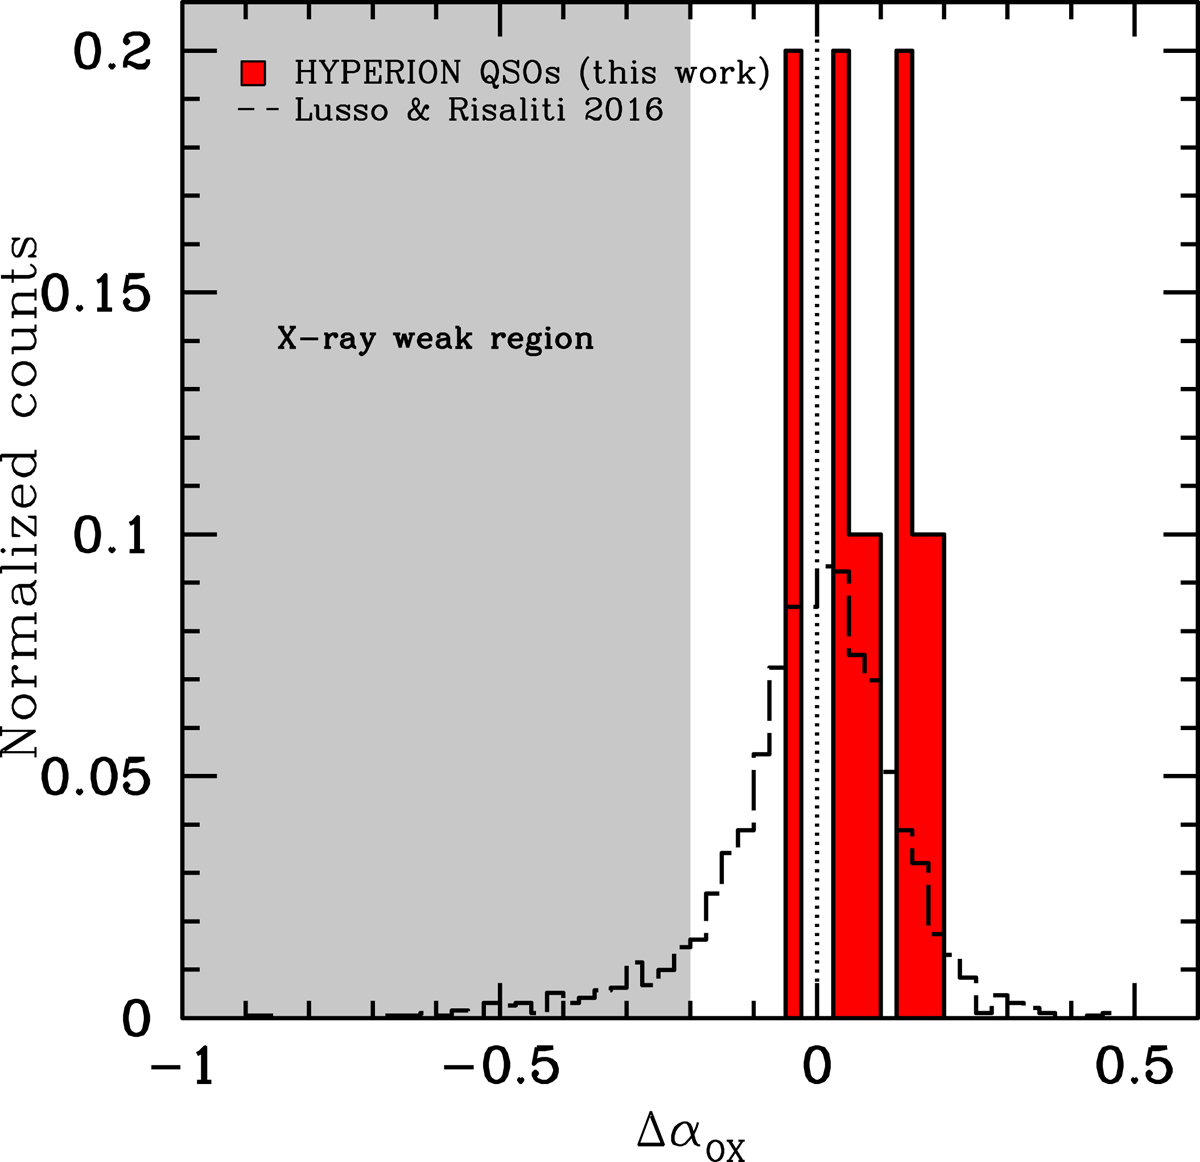
Normalized distributions of the ΔαOX relative to the relation from Lusso & Risaliti (2016; see Fig. 8) for HYPERION QSOs (red filled histogram) and the AGN detected with S/N > 5 from Lusso & Risaliti (2016; dashed hollow histogram). The gray region marks the position of the X-ray-weak sources.
Current usage metrics show cumulative count of Article Views (full-text article views including HTML views, PDF and ePub downloads, according to the available data) and Abstracts Views on Vision4Press platform.
Data correspond to usage on the plateform after 2015. The current usage metrics is available 48-96 hours after online publication and is updated daily on week days.
Initial download of the metrics may take a while.