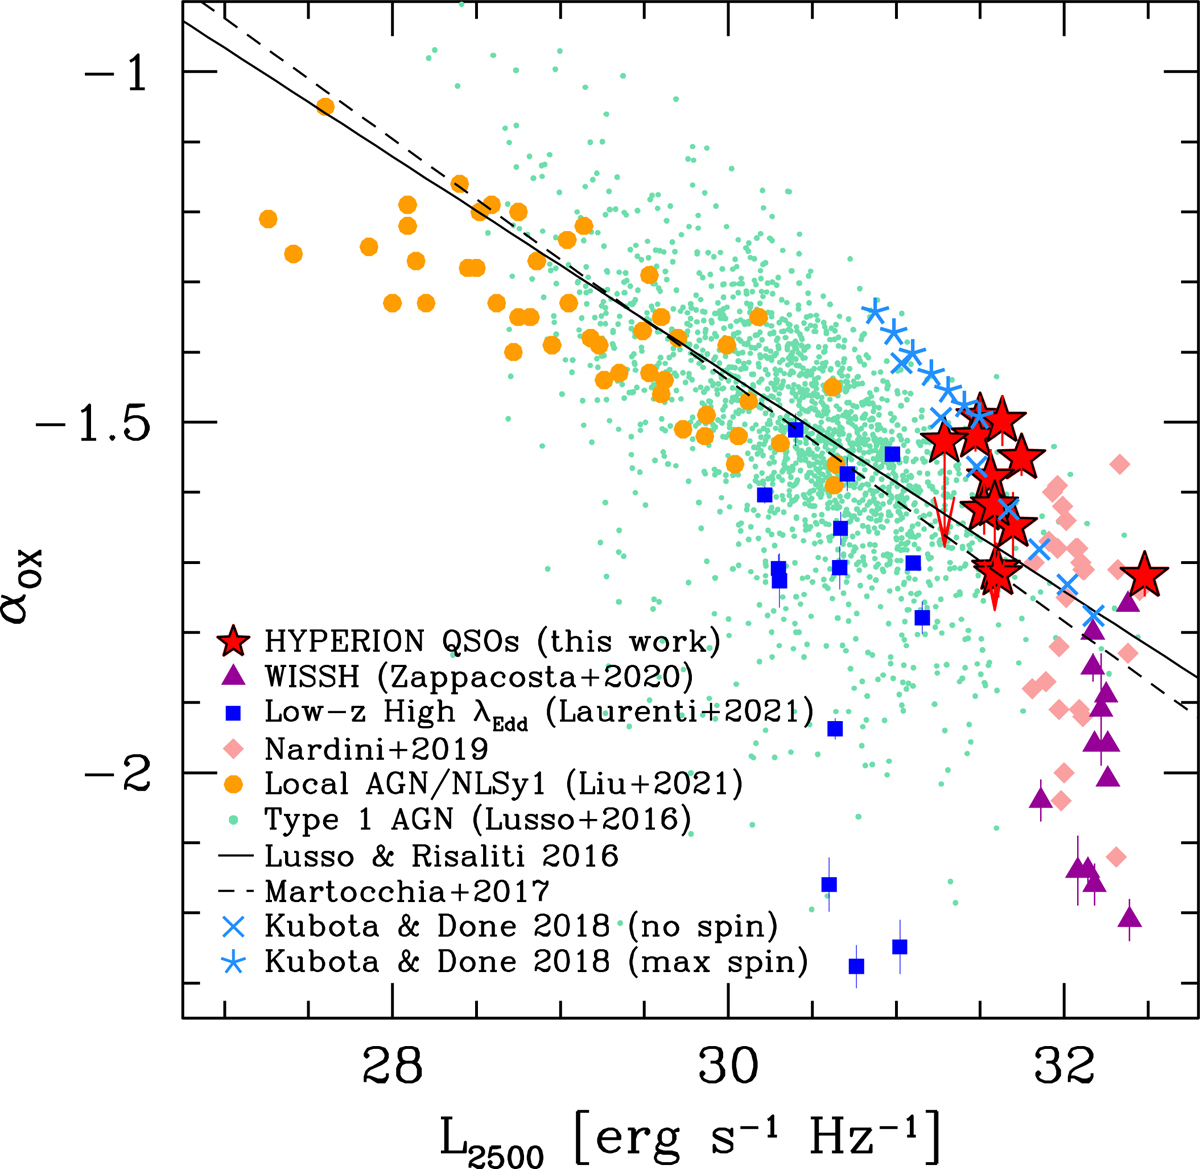
Fig. 8.
Download original image
αOX vs. L2500 Å for a compilation of AGN catalogs. Symbols refer to the AGN samples as in Fig. 4, except for the green dots, which are detected AGN with S/N > 5 from Lusso & Risaliti (2016). Upper limits for the HYPERION QSOs are estimated assuming a power law with fixed Γ = 2.4 (see Sect. 3 and Table 4). The dashed line is the linear fit from Martocchia et al. (2017) while the solid line refers to the best-fit relation from Lusso & Risaliti (2016) and for the subsample with S/N > 5, E(B − V)≥0.1, and 1.6 ≤ Γ1 − 5 ≤ 2.8, with Γ1 − 5 being the photon index estimated between the luminosities at 1 keV and 5 keV. Light blue crosses and asterisks present the values predicted by the QSOSED model (Kubota & Done 2018) assuming average HYPERION parameters and spin a = 0 and a = 1, respectively. These values are reported from top-left to bottom-right from log ṁ = −1 to log ṁ = 0.2 in steps of Δlog ṁ = 0.2.
Current usage metrics show cumulative count of Article Views (full-text article views including HTML views, PDF and ePub downloads, according to the available data) and Abstracts Views on Vision4Press platform.
Data correspond to usage on the plateform after 2015. The current usage metrics is available 48-96 hours after online publication and is updated daily on week days.
Initial download of the metrics may take a while.