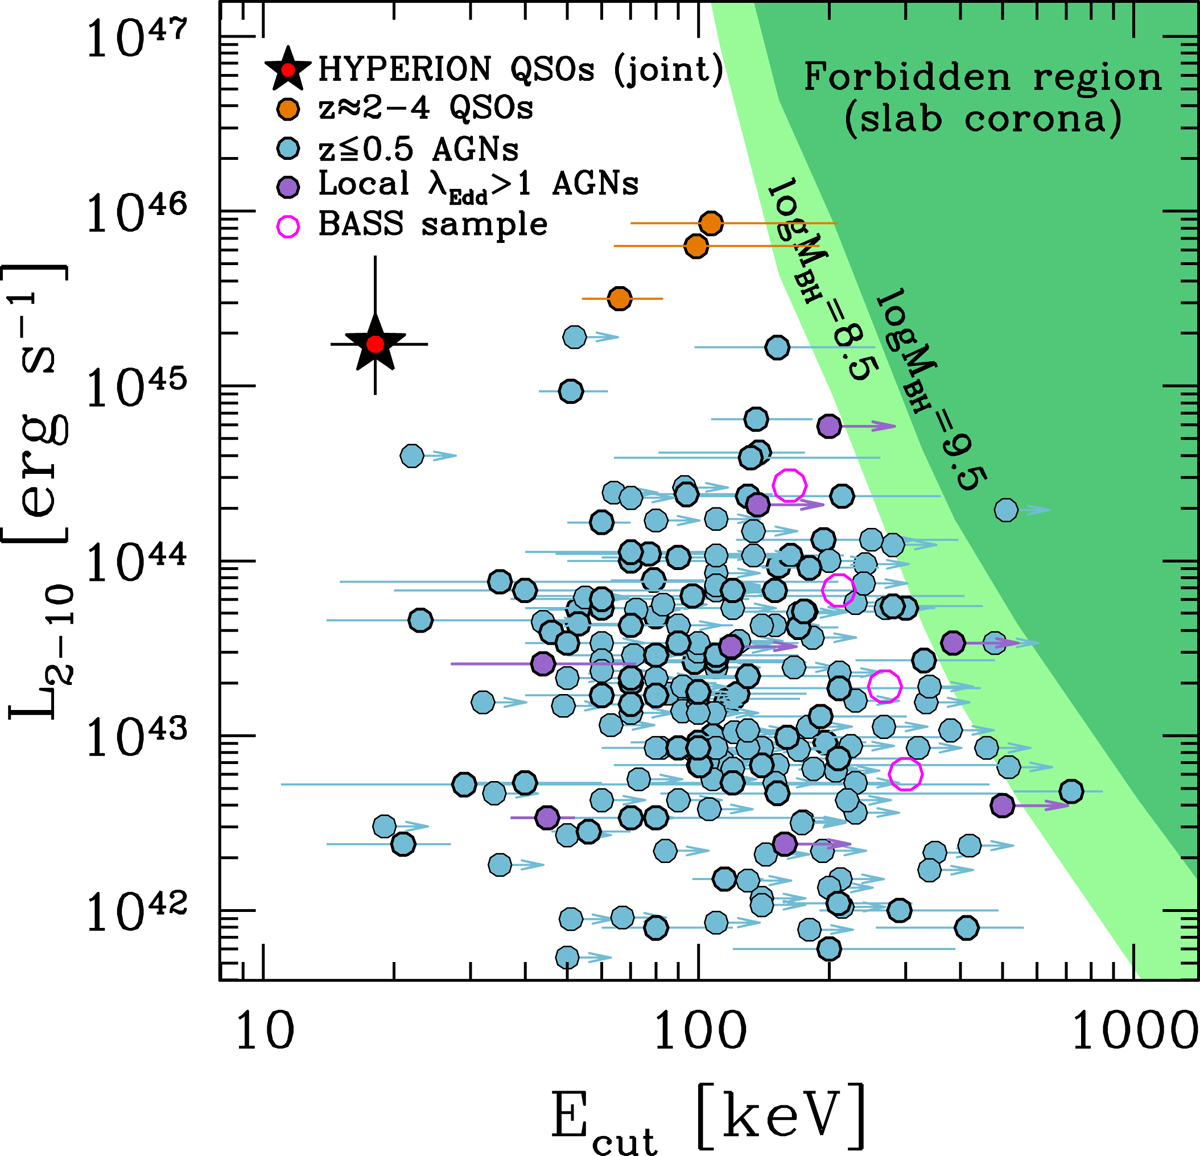
Fig. 6.
Download original image
Distribution of Ecut as a function of L2 − 10. Light blue and orange filled circles are estimates from a compilation of local AGN (Bertola et al. 2022, and references therein) and z ≈ 2 − 4 QSOs (Lanzuisi et al. 2019; Bertola et al. 2022). Purple circles are from local super Eddington accreting AGN from Tortosa et al. (2023). Hollow magenta circles are binned averages estimated by Ricci et al. (2018) for a large sample of local AGN from the BAT AGN Spectroscopic Survey (BASS). The HYPERION average Ecut measurement (assuming Γ = 1.9) from our joint analysis is reported as a black star with an inner red circle. Green regions are the forbidden regions (for a slab corona model) due to runaway electron–positron pair production (see Svensson 1984) for log(MBH/M⊙) = 8.5 and log(MBH/M⊙) = 9.5.
Current usage metrics show cumulative count of Article Views (full-text article views including HTML views, PDF and ePub downloads, according to the available data) and Abstracts Views on Vision4Press platform.
Data correspond to usage on the plateform after 2015. The current usage metrics is available 48-96 hours after online publication and is updated daily on week days.
Initial download of the metrics may take a while.