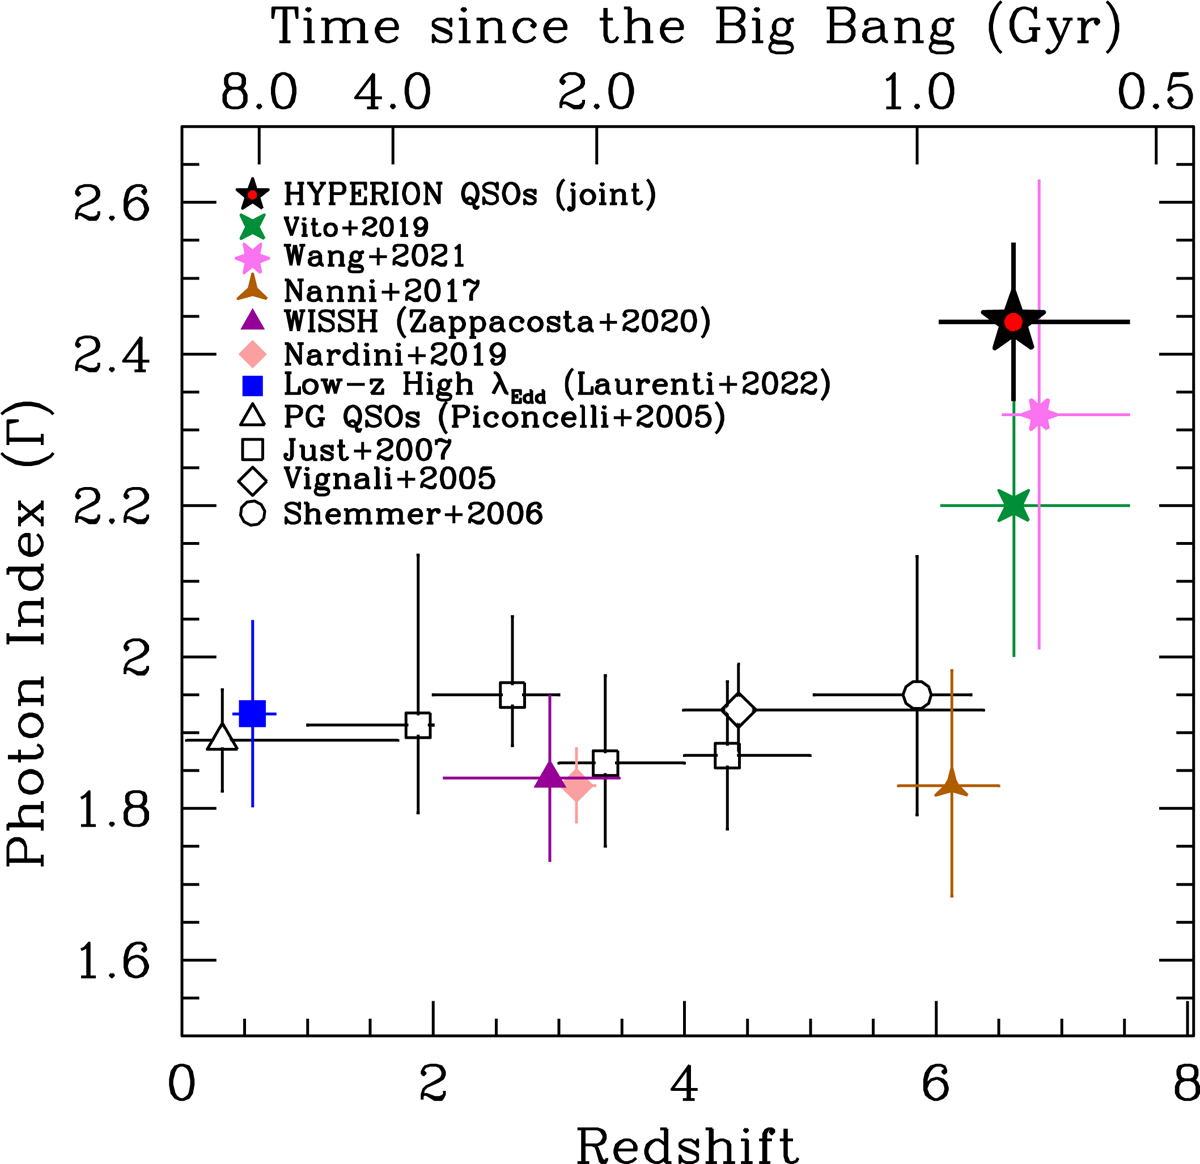
Fig. 5.
Download original image
Distribution of the average Γ as a function of redshift. The plot includes data from joint spectral analysis or average values from samples of QSOs. In particular, starred data are from joint spectral analysis of samples of z > 6 QSOs. The black star with a central red circle, the green four-pointed star, the magenta six-pointed star, and the three-pointed star are HYPERION QSOs, and the samples of Vito et al. (2019), Wang et al. (2021a), and Nanni et al. (2017), respectively. The empty squares, diamond, and circle are averages from the stacked spectral analyses of luminous and hyperluminous QSOs from Just et al. (2007), Vignali et al. (2005), and Shemmer et al. (2006b), respectively. The empty triangle represents the average Γ from the PG quasars (Piconcelli et al. 2005). Blue squares are high-λEdd local QSOs (Laurenti et al. 2022) and purple triangles are hyperluminous high-λEdd WISSH QSOs (Zappacosta et al. 2020). Pink diamonds are z ∼ 3 luminous blue quasars from Nardini et al. (2019). Vertical error bars report 1σ uncertainties on Γ while horizontal error bars indicate the redshift range covered by the QSO sample considered in each dataset.
Current usage metrics show cumulative count of Article Views (full-text article views including HTML views, PDF and ePub downloads, according to the available data) and Abstracts Views on Vision4Press platform.
Data correspond to usage on the plateform after 2015. The current usage metrics is available 48-96 hours after online publication and is updated daily on week days.
Initial download of the metrics may take a while.