Fig. 3.
Download original image
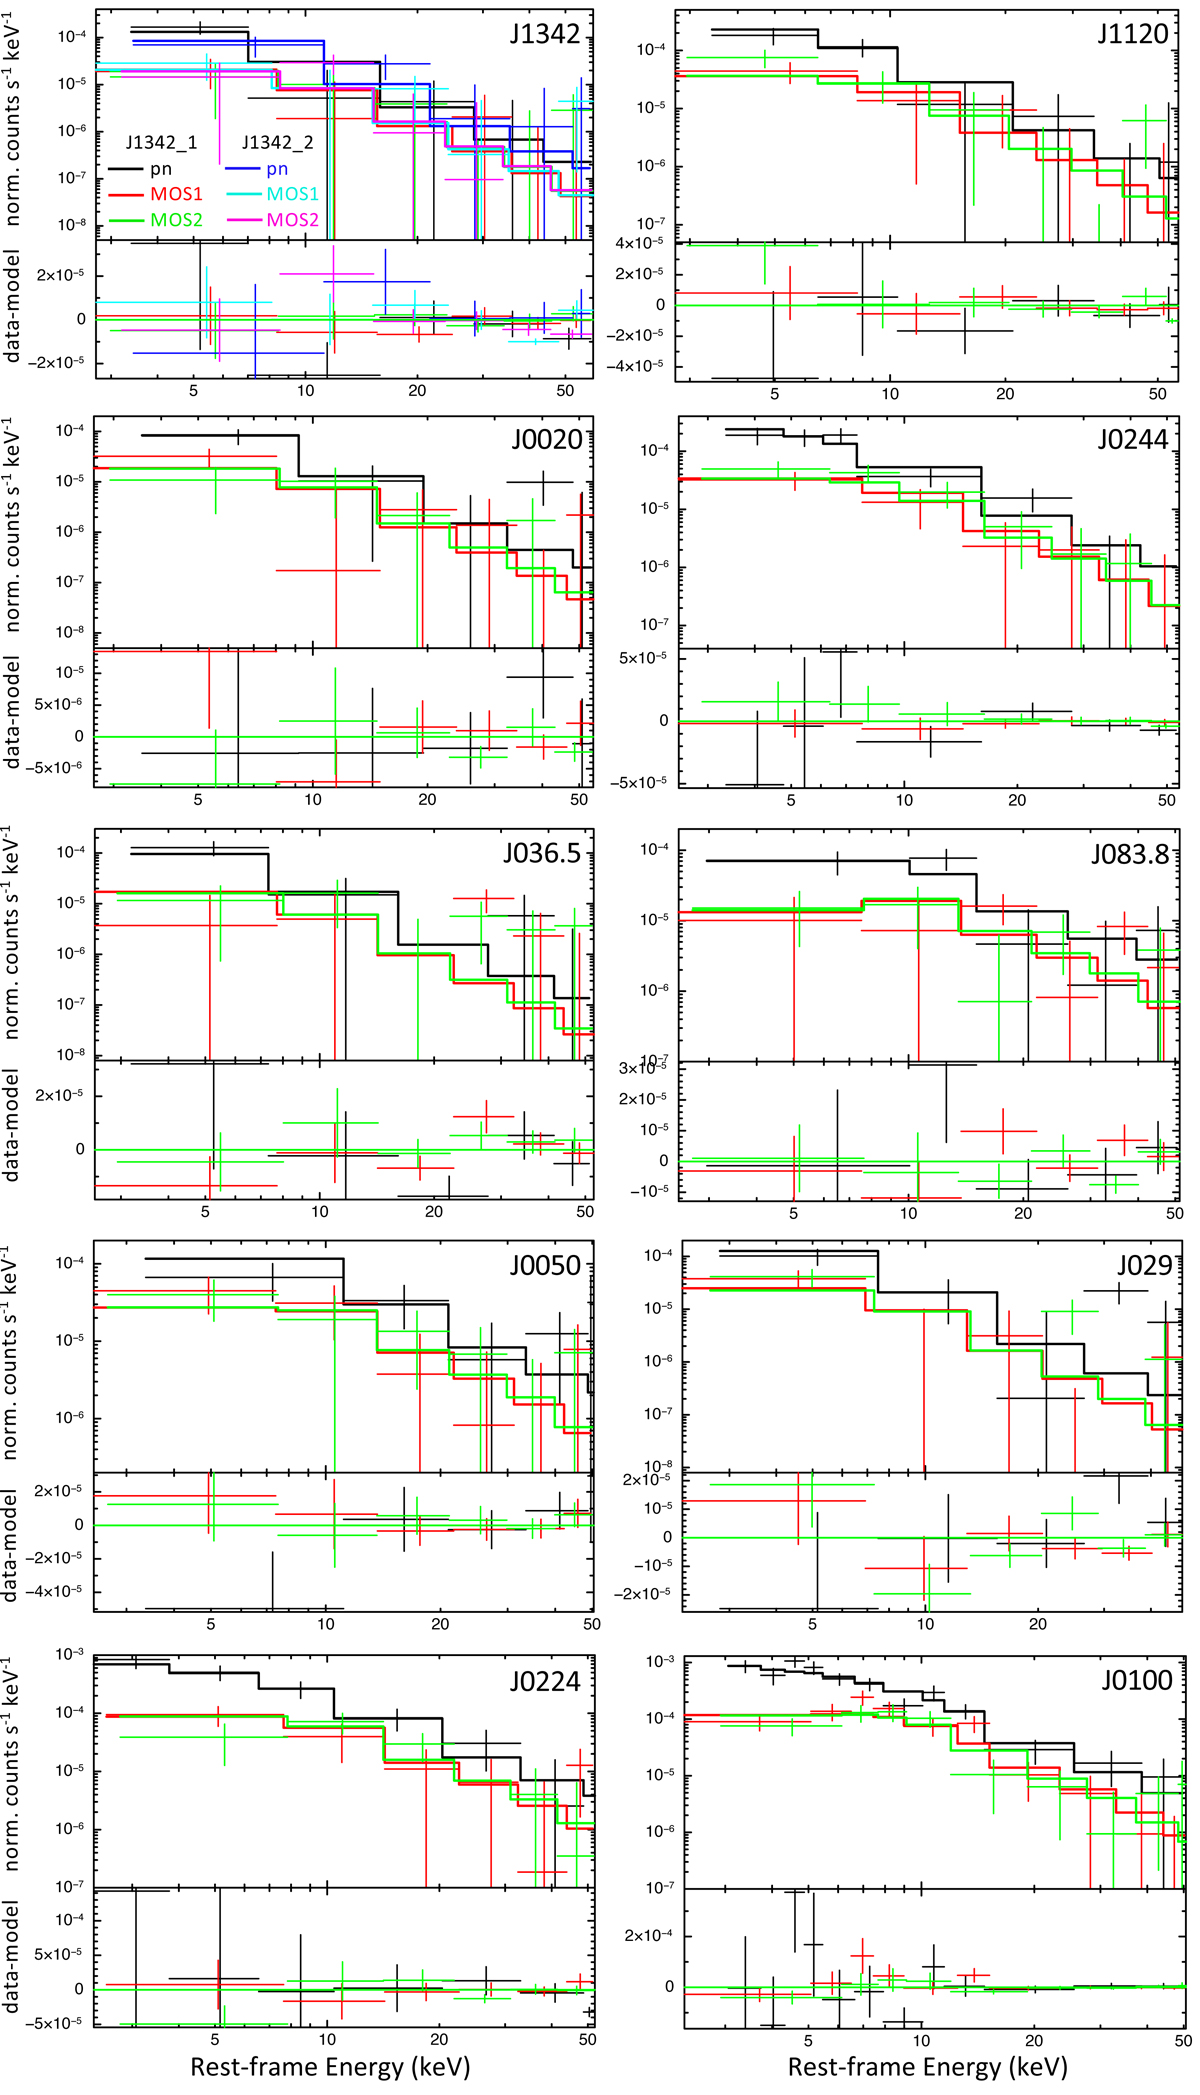
XMM-Newton pn (black), MOS1 (red), and MOS2 (green) 0.3–7 keV spectra and best-fit models (stepped continuous thick lines) for the ten detected HYPERION QSOs presented in this paper. Spectra were further rebinned for visual purposes and are reported at their rest-frame energy. Residuals are shown as data minus best-fit model in the bottom panels. For the source J1342, blue, cyan, and magenta represent the second data set.
Current usage metrics show cumulative count of Article Views (full-text article views including HTML views, PDF and ePub downloads, according to the available data) and Abstracts Views on Vision4Press platform.
Data correspond to usage on the plateform after 2015. The current usage metrics is available 48-96 hours after online publication and is updated daily on week days.
Initial download of the metrics may take a while.