Fig. 10.
Download original image
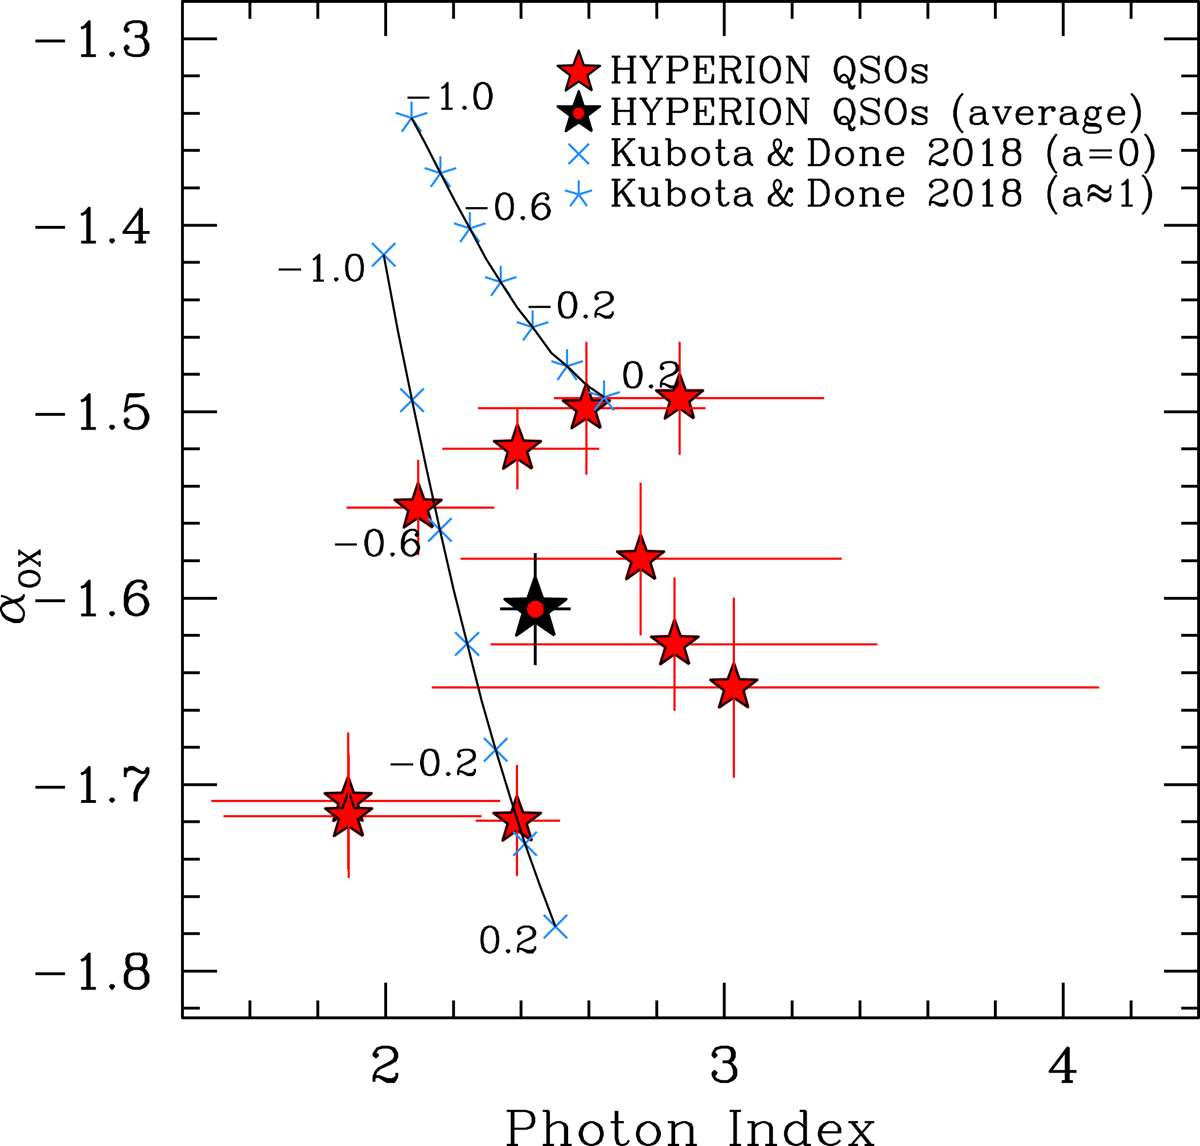
Γ vs. αOX for HYPERION QSOs compared to the QSOSED model prediction. Red stars are single HYPERION QSOs, while the black star with central red circle shows the average αOX and joint best-fit Γ for the detected HYPERION QSOs. Light blue crosses and asterisks are the model predictions (for a = 0 and a ≈ 1, respectively) whose labels report the log ṁ value.
Current usage metrics show cumulative count of Article Views (full-text article views including HTML views, PDF and ePub downloads, according to the available data) and Abstracts Views on Vision4Press platform.
Data correspond to usage on the plateform after 2015. The current usage metrics is available 48-96 hours after online publication and is updated daily on week days.
Initial download of the metrics may take a while.