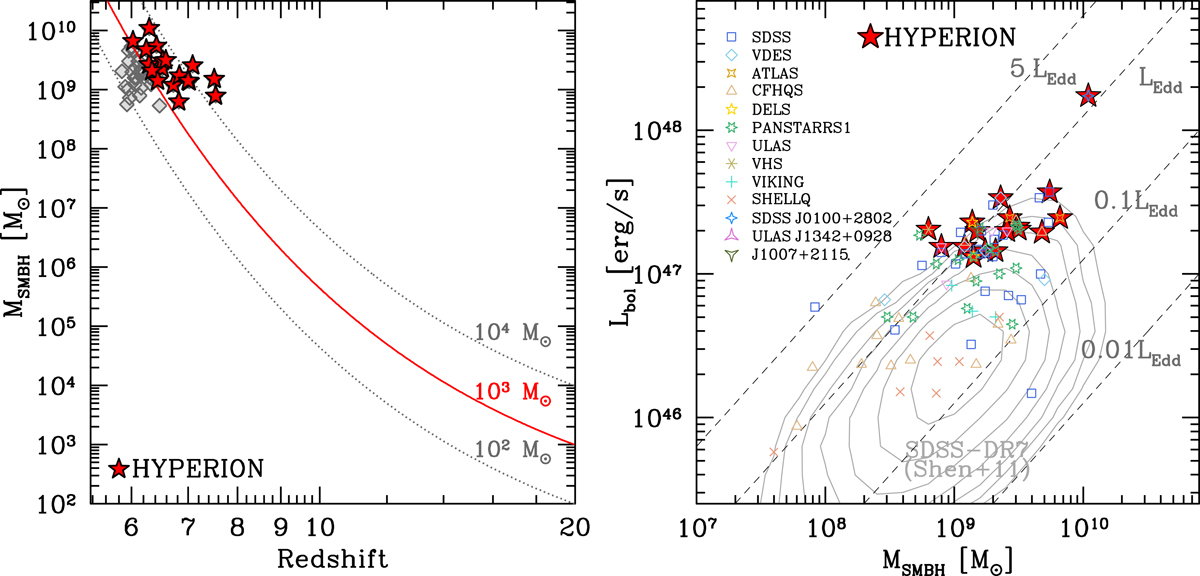
Fig. 1.
Download original image
Selection and properties of the HYPERION sample. Left: SMBH mass as a function of redshift. All the reported points (diamonds and stars) are the subsample of 46 hyperluminous (Lbol > 1047 erg s−1) quasars with known SMBH masses reported at the end of 2020. The final selected 18 sources are reported as red stars. The curves represent the exponential growth of seed BHs of different masses (labeled) formed at z = 20, assuming continuous accretion (fduty = 1) at the Eddington rate (λEdd = 1; see Sect. 2). The red curve, corresponding to a growing seed of 1000 M⊙, was used to select the HYPERION sample. Right: distribution of the HYPERION sample in the MBH vs. Lbol plane (red stars) along with the distribution of the 83 z > 6 quasars with available MBH. All MBH are based on single-epoch MgII virial estimator and Lbol is from bolometric correction from the literature as of 2020. MBH and Lbol were consistently recomputed for all sources assuming the same ΛCDM cosmology and adopting the mass calibration from Vestergaard & Osmer (2009) and a bolometric correction of 5.15 to the 3000 Å luminosity from Richards et al. (2006). Dashed lines report the location of sources emitting a fixed fraction of LEdd. The contours report the location of the lower redshift (z = 0.7 − 1.9) SDSS-DR7 quasars from Shen et al. (2011) with MgII-derived masses.
Current usage metrics show cumulative count of Article Views (full-text article views including HTML views, PDF and ePub downloads, according to the available data) and Abstracts Views on Vision4Press platform.
Data correspond to usage on the plateform after 2015. The current usage metrics is available 48-96 hours after online publication and is updated daily on week days.
Initial download of the metrics may take a while.