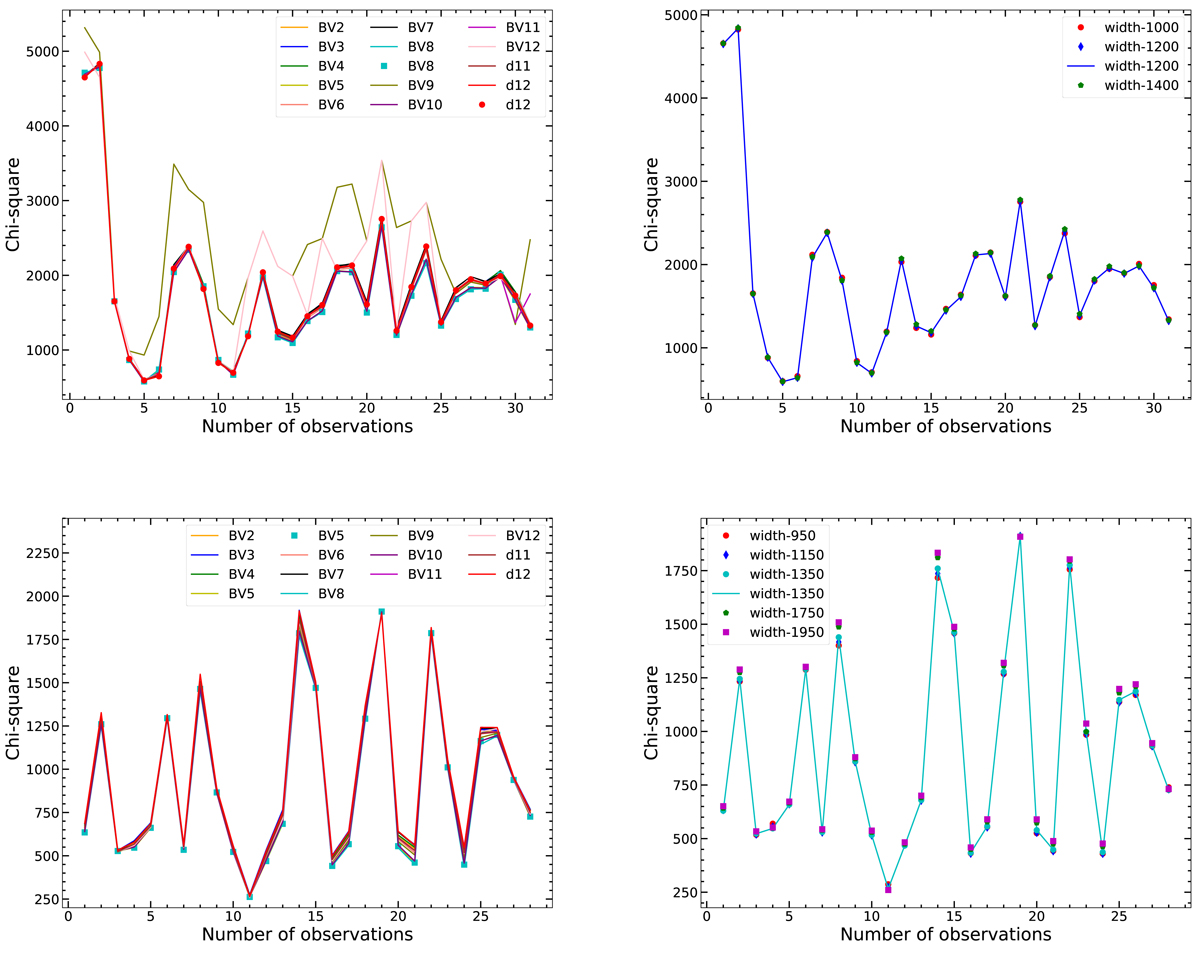
Fig. D.1.
Download original image
We show the distribution of chi-square value for different FeII templates and widths. The left panel represents the chi-square distribution of different templates that have been used to model the UV Fe II emission. The right panel shows the chi-square distribution when various velocity widths (km/s) were chosen to model the UV FeII. The upper panel and lower panel are for HE 0413 and HE 0435 sources. The templates name are the following: BV2: d11-5-m20-20-5.dat, BV3: d11-m05-20-5.dat, BV4: d11-m10-20-5.dat, BV5: d11-m20-20.5-735.dat, BV6: d11-m20-20-5.dat, BV7: d11-m20-20.dat, BV8: d11-m20-21-735.dat, BV9: d11-m20-21.dat, BV10: d11-m30-20-5-735.dat, BV11: d11-m30-20-5.dat, BV12: d11-m50-20-5.dat, d11: d11-m20-20-5.dat, d12: d12-m20-20-5.dat.
Current usage metrics show cumulative count of Article Views (full-text article views including HTML views, PDF and ePub downloads, according to the available data) and Abstracts Views on Vision4Press platform.
Data correspond to usage on the plateform after 2015. The current usage metrics is available 48-96 hours after online publication and is updated daily on week days.
Initial download of the metrics may take a while.