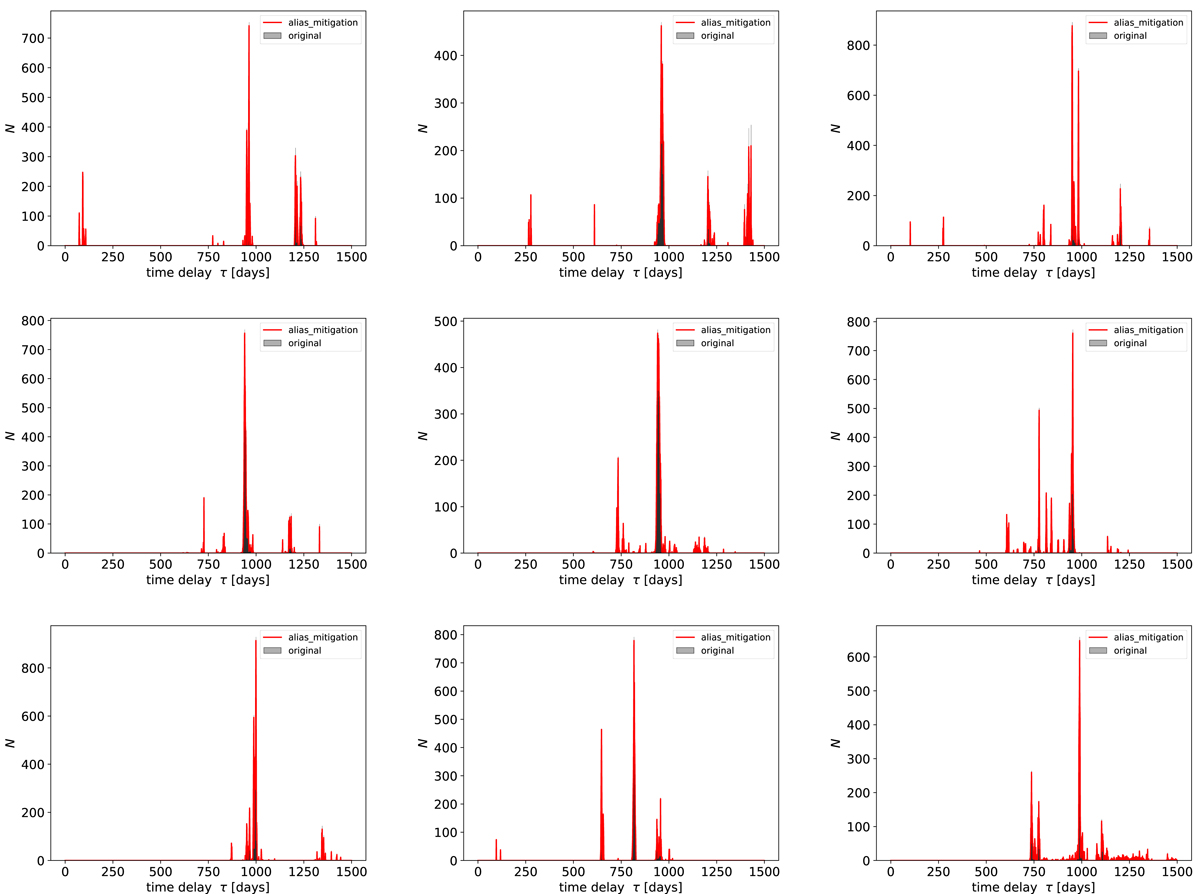
Fig. A.2.
Download original image
Javelin bootstrap results from HE 0413 with 1500 realisations for all the seven curves (from left to right) along with total MgII and FeII (last two plots of the lower panel). The peak and results from this are listed in Table 3. We also use the alias mitigation using down-weighting by the overlapping pairs. The black histogram represents the original delay distribution and the red one is after alias mitigation.
Current usage metrics show cumulative count of Article Views (full-text article views including HTML views, PDF and ePub downloads, according to the available data) and Abstracts Views on Vision4Press platform.
Data correspond to usage on the plateform after 2015. The current usage metrics is available 48-96 hours after online publication and is updated daily on week days.
Initial download of the metrics may take a while.