Fig. 15.
Download original image
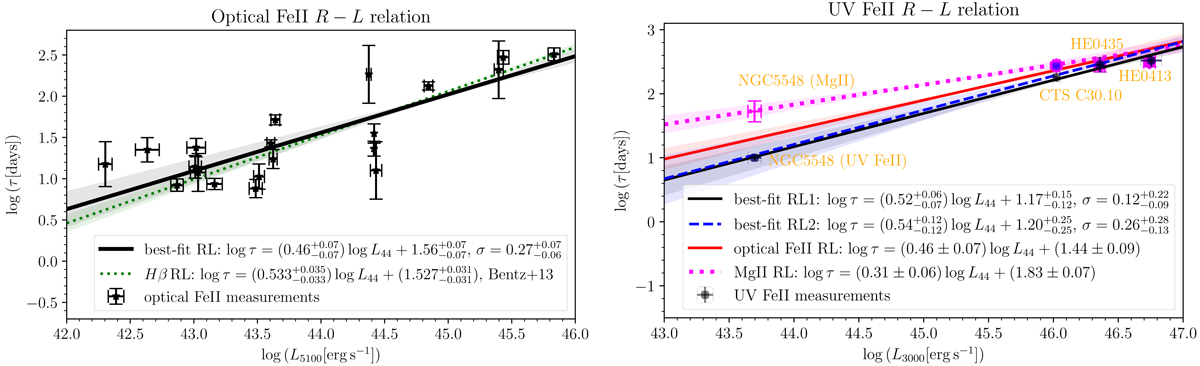
Radius–luminosity relation for the broad FeII complex. Left panel: optical FeII R–L based on 20 measurements (points with error bars; see Table C.1) and the corresponding best-fit relation (black solid line). The best-fit coefficients are in the legend. The intrinsic scatter is σ = 0.27 dex. For comparison, the Hβ RL relation (Bentz et al. 2013) is plotted using a dotted green line. Both the optical FeII and the Hβ RL relations are in agreement with the uncertainties. Right panel: ultraviolet FeII R–L relation based on the four measurements summarised in Table B.1. The black solid line and the blue dashed line represent the best-fit solutions considering two different FeII time delays for CTS C30.10. The UV FeII R–L relation is compared to the optical FeII R–L relation (red solid line), which is rescaled from 5100 Å to 3000 Å using the bolometric corrections of Netzer (2019). A vertical offset between the two R–L relations is apparent, which corresponds to the potential mean size difference between the optical FeII-emitting region and the UV FeII-emitting region of RFeII-opt ∼ (1.7 − 1.9)RFeII-UV, assuming the same slope of γ = 0.5 within the uncertainties. In addition, we also plot the MgII R–L relation based on 94 measurements (dotted magenta line). This relation is flatter than the UV FeII R–L relation and has a larger intercept. However, it is consistent with the MgII time-delay measurements (magenta points) for four UV FeII sources.
Current usage metrics show cumulative count of Article Views (full-text article views including HTML views, PDF and ePub downloads, according to the available data) and Abstracts Views on Vision4Press platform.
Data correspond to usage on the plateform after 2015. The current usage metrics is available 48-96 hours after online publication and is updated daily on week days.
Initial download of the metrics may take a while.