Open Access
Fig. 12.
Download original image
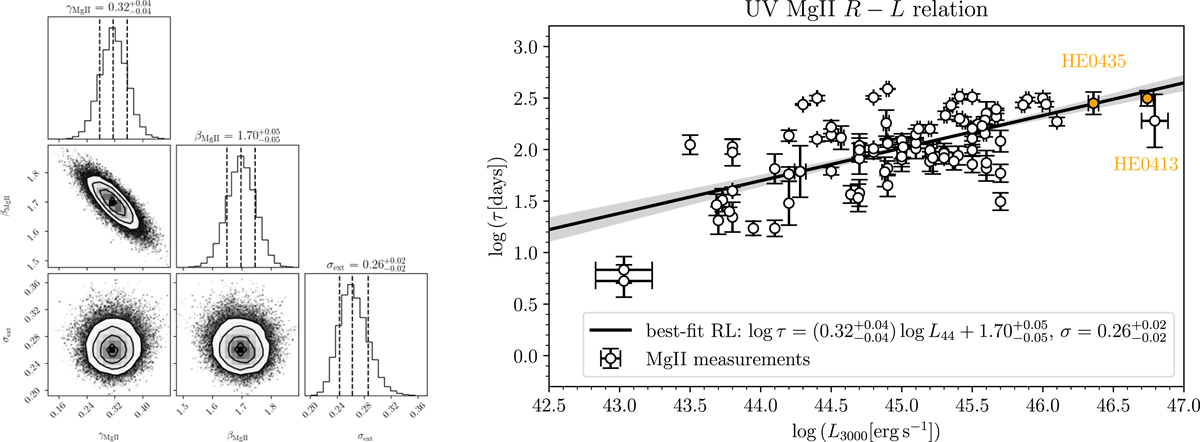
MgII R–L relation parameters (see the corner plot to the left) and comparison of the maximum-likelihood R–L relation with 94 measurements. The scatter of the relation is ![]() . The two quasars studied in this paper are marked as orange circles and belong to the highest luminosity MgII sources.
. The two quasars studied in this paper are marked as orange circles and belong to the highest luminosity MgII sources.
Current usage metrics show cumulative count of Article Views (full-text article views including HTML views, PDF and ePub downloads, according to the available data) and Abstracts Views on Vision4Press platform.
Data correspond to usage on the plateform after 2015. The current usage metrics is available 48-96 hours after online publication and is updated daily on week days.
Initial download of the metrics may take a while.