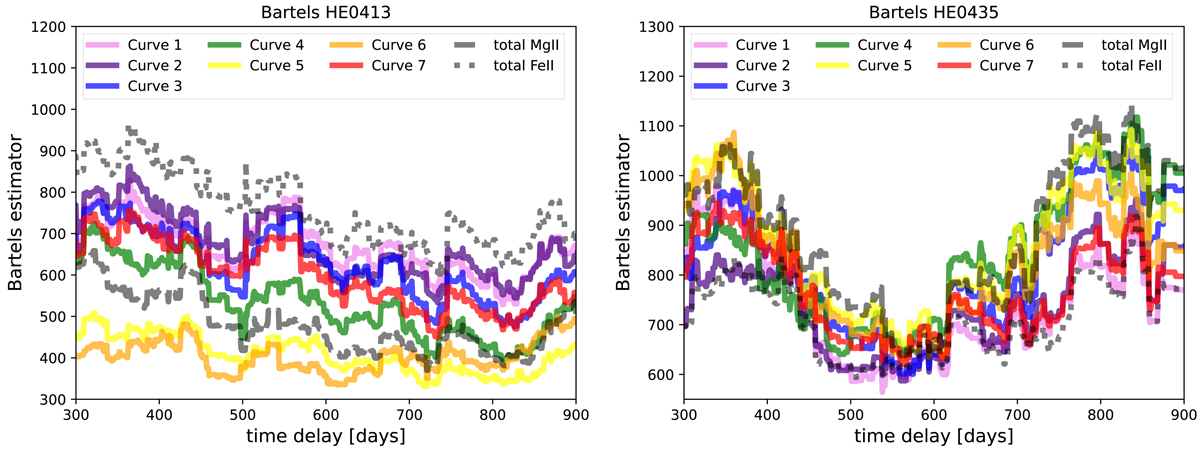
Fig. 11.
Download original image
Bartels estimator results for HE 0413-4031 and HE 0435-4312. Left panel: temporal evolution of the Bartels estimator for seven light-curve bins of HE 0413-4031 (rainbow-coloured solid lines). The total MgII emission is represented by a black dashed line, while the total FeII emission is depicted by a dotted black line. Right panel: same for HE 0435-4312.
Current usage metrics show cumulative count of Article Views (full-text article views including HTML views, PDF and ePub downloads, according to the available data) and Abstracts Views on Vision4Press platform.
Data correspond to usage on the plateform after 2015. The current usage metrics is available 48-96 hours after online publication and is updated daily on week days.
Initial download of the metrics may take a while.