Fig. 1.
Download original image
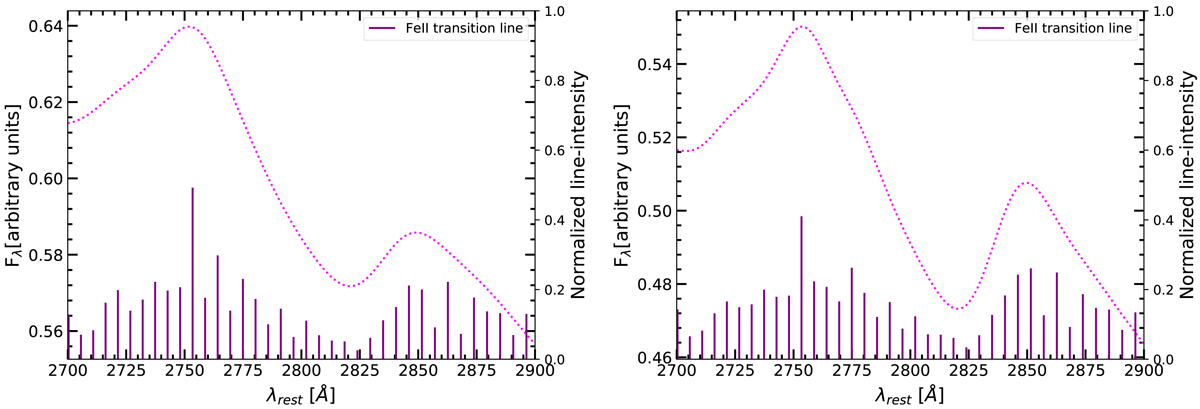
Pseudo-continuum UV FeII emission profile (dotted magenta) obtained by smearing the FeII transition lines (purple) by a velocity profile of 2820 km s−1 for HE 0413-4031 (left panel) and 2350 km s−1 for HE 0435-4312 (right panel). Transition lines are theoretical predictions taken from FeII templates (Bruhweiler & Verner 2008) d12-m20-20-5.dat for HE 0413-4031 and d11-m20-20.5-735.dat for HE 0435-4312.
Current usage metrics show cumulative count of Article Views (full-text article views including HTML views, PDF and ePub downloads, according to the available data) and Abstracts Views on Vision4Press platform.
Data correspond to usage on the plateform after 2015. The current usage metrics is available 48-96 hours after online publication and is updated daily on week days.
Initial download of the metrics may take a while.