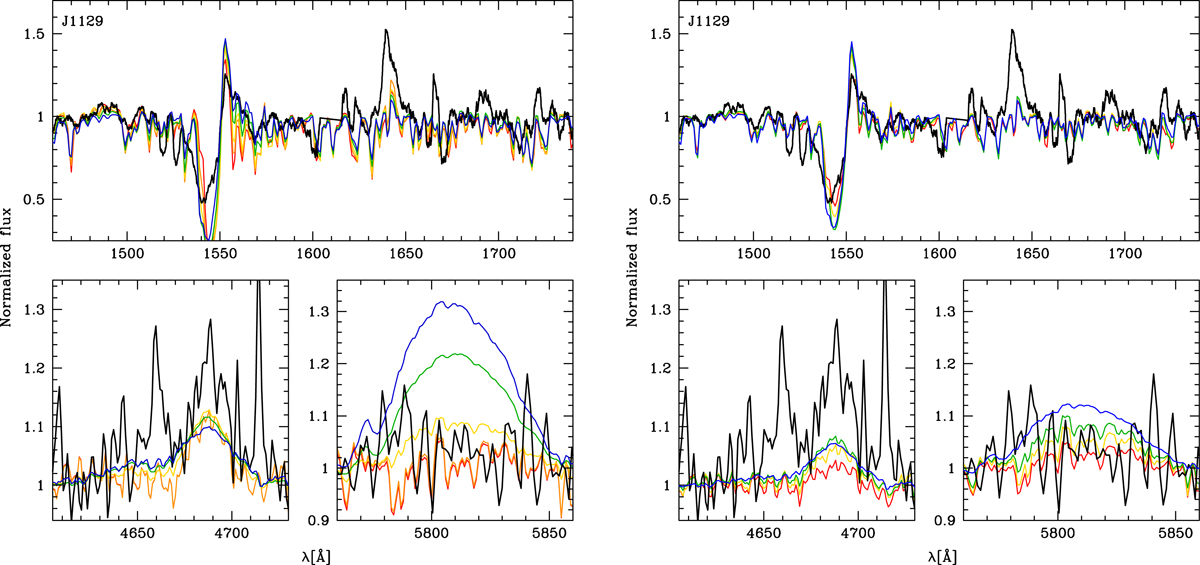
Fig. 9.
Download original image
Comparison of the normalized observed spectrum of J1129 in black with BPASS models. Left panel: burst models at 3, 4, 5, 6, and 8 Myr in blue, green, yellow, orange, and red, respectively. The models include binaries and an upper-mass cutoff of 300 M⊙, as implemented in Eldridge et al. (2017). Right panel: CSF models at an age of 5, 10, 20, and 50 Myr in blue, green, yellow, and red, respectively.
Current usage metrics show cumulative count of Article Views (full-text article views including HTML views, PDF and ePub downloads, according to the available data) and Abstracts Views on Vision4Press platform.
Data correspond to usage on the plateform after 2015. The current usage metrics is available 48-96 hours after online publication and is updated daily on week days.
Initial download of the metrics may take a while.