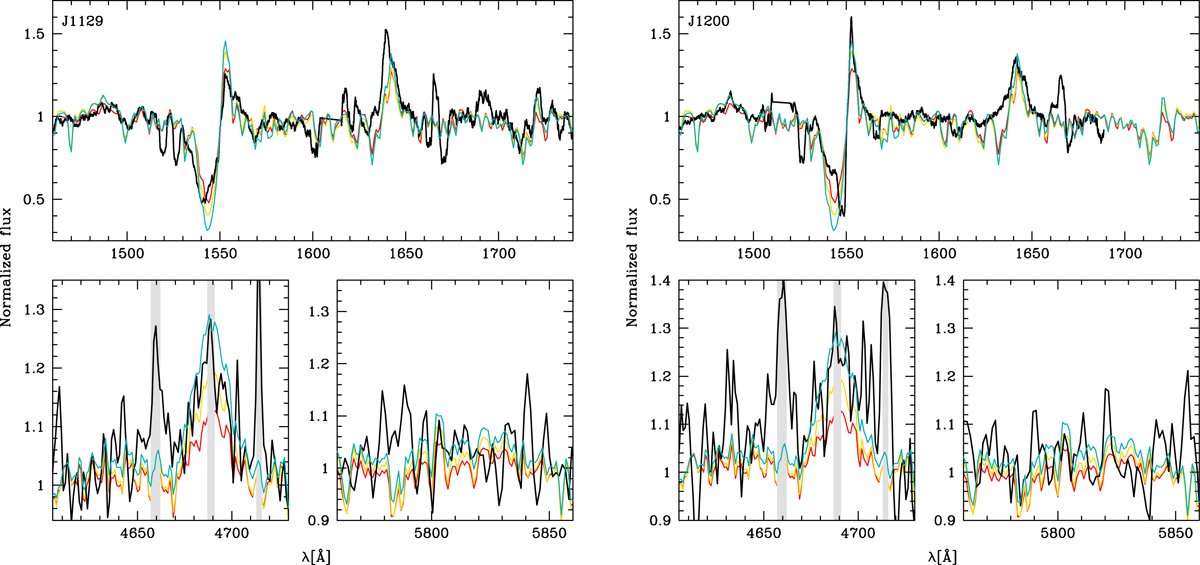
Fig. 8.
Download original image
Comparison of the normalized observed spectrum of the VMS sources in black (left: J1129; right: J1200) with CSF models that include VMS. The model shown in cyan (yellow and red) has an age of 10 (20 and 50) Myr. The gray areas in the bottom left panel mark the position of the nebular lines of [Fe III] 4658, He II 4686, and [Ar IV] 4711.
Current usage metrics show cumulative count of Article Views (full-text article views including HTML views, PDF and ePub downloads, according to the available data) and Abstracts Views on Vision4Press platform.
Data correspond to usage on the plateform after 2015. The current usage metrics is available 48-96 hours after online publication and is updated daily on week days.
Initial download of the metrics may take a while.