Open Access
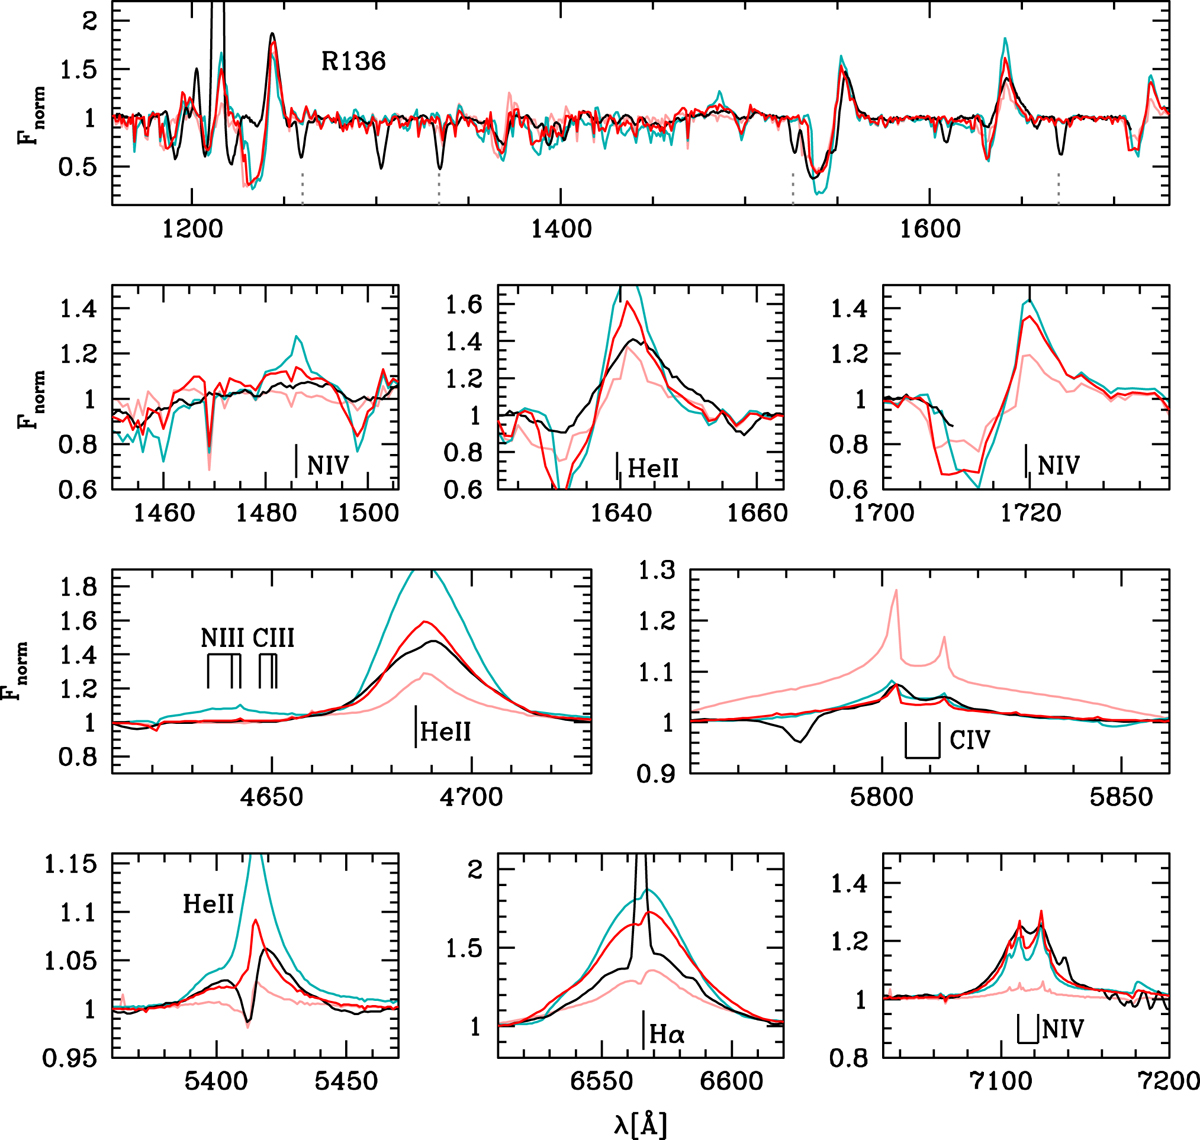
Fig. 6.
Download original image
Comparison of the normalized observed spectrum of R136 in black with population synthesis models including VMS in color. The pink, red, and cyan models correspond to an age of 1, 1.5, and 2 Myr, respectively. The main stellar lines are labeled. The gray dotted lines are interstellar features.
Current usage metrics show cumulative count of Article Views (full-text article views including HTML views, PDF and ePub downloads, according to the available data) and Abstracts Views on Vision4Press platform.
Data correspond to usage on the plateform after 2015. The current usage metrics is available 48-96 hours after online publication and is updated daily on week days.
Initial download of the metrics may take a while.