Fig. 5.
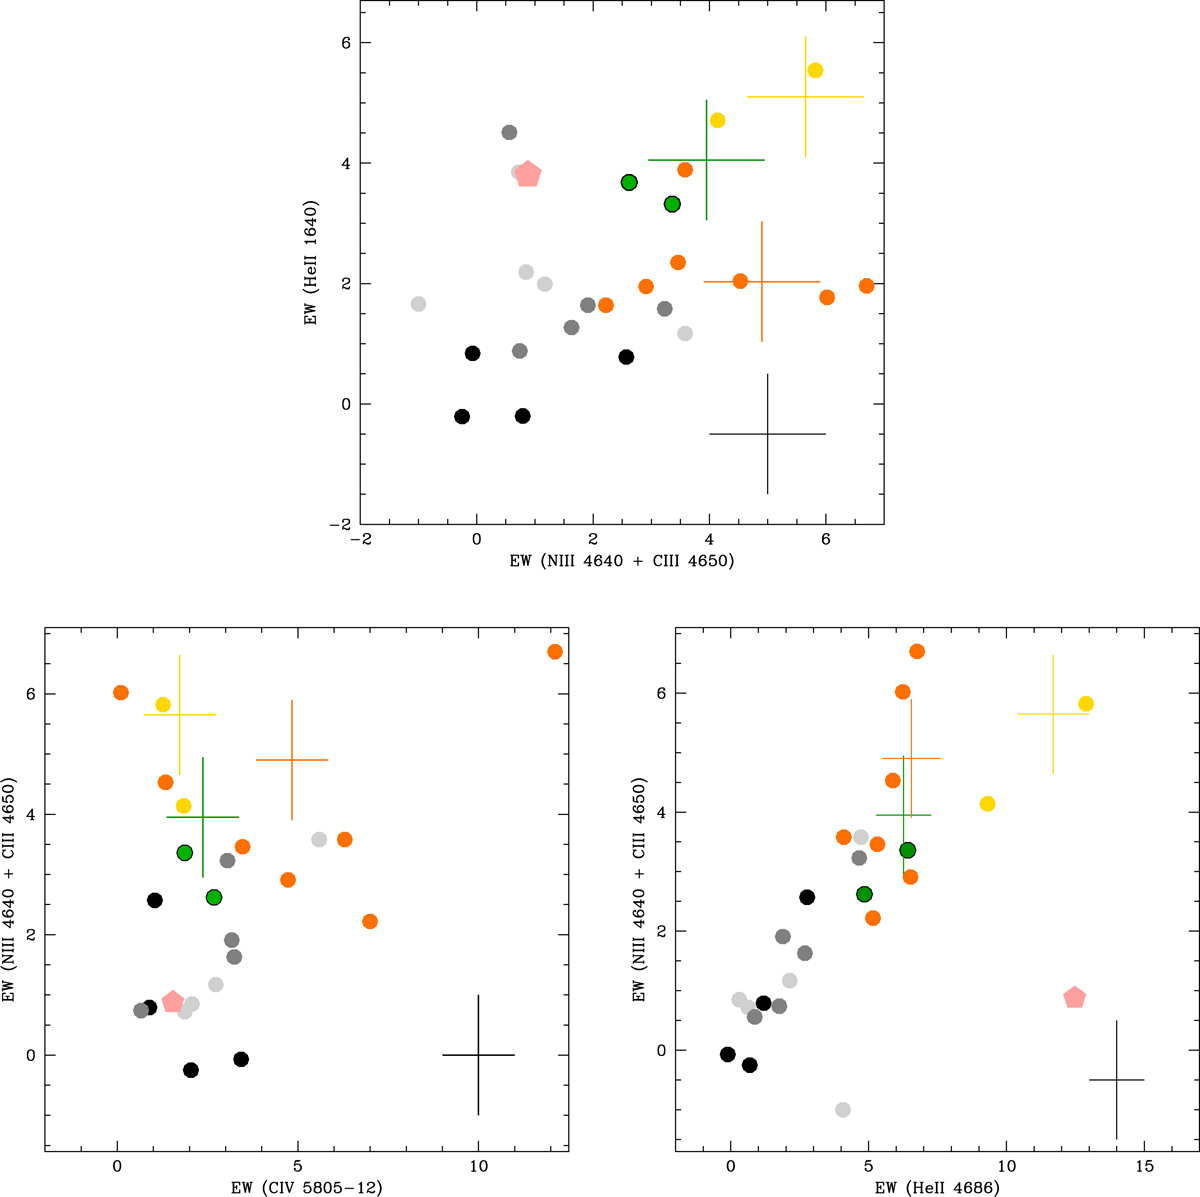
Download original image
Comparison between the EW of various lines. Top panel: EW(He II 1640) vs. EW(N III 4640+C III 4650). Bottom left panel: EW(N III 4640+C III 4650) vs. EW(C IV 5801-12). Bottom right panel: EW(N III 4640+C III 4650) vs. EW(He II 4686). Circles show the sample sources. Green (with an external black circle), orange, and yellow correspond to sources hosting VMS, WR, and VMS or WR, respectively. Black symbols correspond to sources without VMS and WR stars. Dark (light) gray symbols are sources tagged as “unknown” (“?”). The pink pentagon is R136. The typical uncertainties on EW measurements are shown by the black cross. The green, orange, and yellow crosses correspond to the measurements on the average spectra shown in Figs. C.1–C.3, respectively.
Current usage metrics show cumulative count of Article Views (full-text article views including HTML views, PDF and ePub downloads, according to the available data) and Abstracts Views on Vision4Press platform.
Data correspond to usage on the plateform after 2015. The current usage metrics is available 48-96 hours after online publication and is updated daily on week days.
Initial download of the metrics may take a while.