Fig. B.1.
Download original image
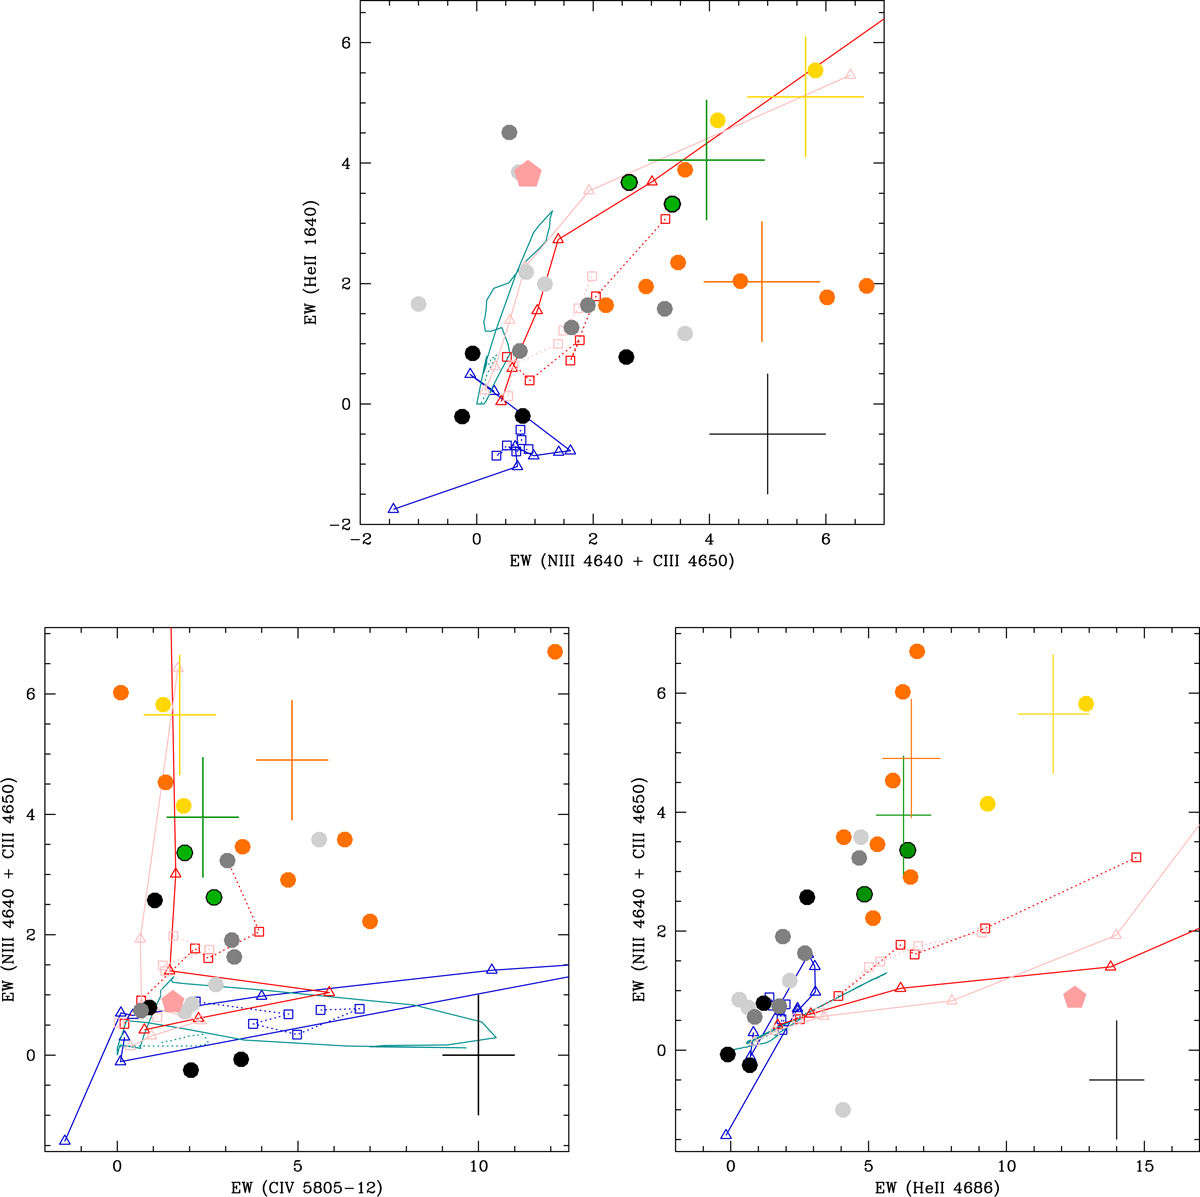
Same as Fig. 5, now including models. The solid lines and open triangles are models for star formation bursts. The dotted lines and open squares are models for continuous star formation. The red models include VMS (present study), the blue models are BPASS, and the cyan models are from Schaerer & Vacca (1998). The pink models are the VMS models that include nebular continuum emission.
Current usage metrics show cumulative count of Article Views (full-text article views including HTML views, PDF and ePub downloads, according to the available data) and Abstracts Views on Vision4Press platform.
Data correspond to usage on the plateform after 2015. The current usage metrics is available 48-96 hours after online publication and is updated daily on week days.
Initial download of the metrics may take a while.