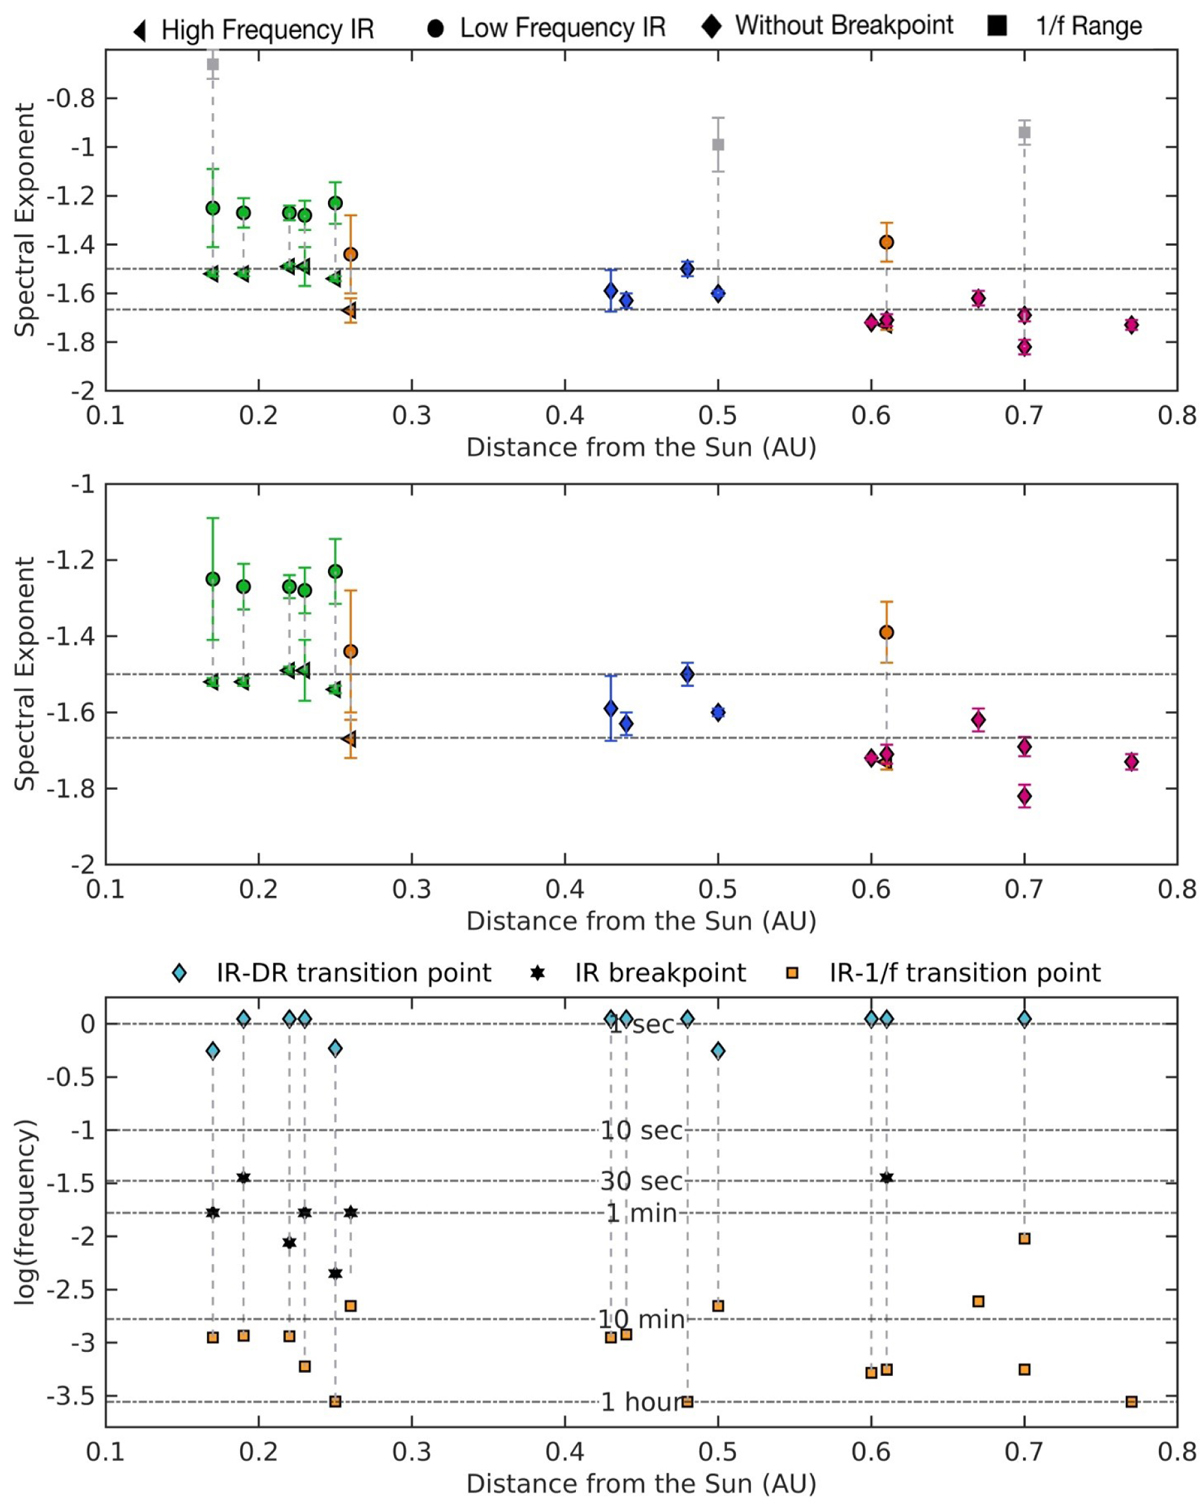
Fig. 8.
Download original image
Fitted power-law range PSD exponent plotted versus distance from the Sun (upper, mid panels) and of frequencies at which spectral breakpoints are found (lower panel), for the PSD trace for intervals in Figs. 1–4 and Table 1. Upper panel: fitted spectral exponents plotted versus distance from the Sun, spanning 0.15 AU to 0.8 AU, for sub-ranges of the wavelet-derived spectrum that we have identified as: ‘1/f’ (grey squares); type I spectra (green); type II spectra (blue); type III spectra (orange); type IV spectra (pink); single IR (diamonds); and IR containing a breakpoint, with exponents for the upper (triangles) and lower frequency ranges (circles) displayed separately. The horizontal dot-dash lines mark the IK (upper) and Kolmogorov (lower) values. Middle panel: Zoon in of the top panel with ‘1/f’ exponents excluded and covering a narrower range of exponent values, between –1 and –2. Lower panel: Frequency limits of the IR identified as transitions to ‘1/f’scaling (yellow squares) and to the KR (blue diamonds), together with the frequency location of the breakpoint within the IR (black hexagrams), if found. Horizontal dot-dash lines indicate frequencies that correspond to periods between 1 s and 1 h.
Current usage metrics show cumulative count of Article Views (full-text article views including HTML views, PDF and ePub downloads, according to the available data) and Abstracts Views on Vision4Press platform.
Data correspond to usage on the plateform after 2015. The current usage metrics is available 48-96 hours after online publication and is updated daily on week days.
Initial download of the metrics may take a while.