Open Access
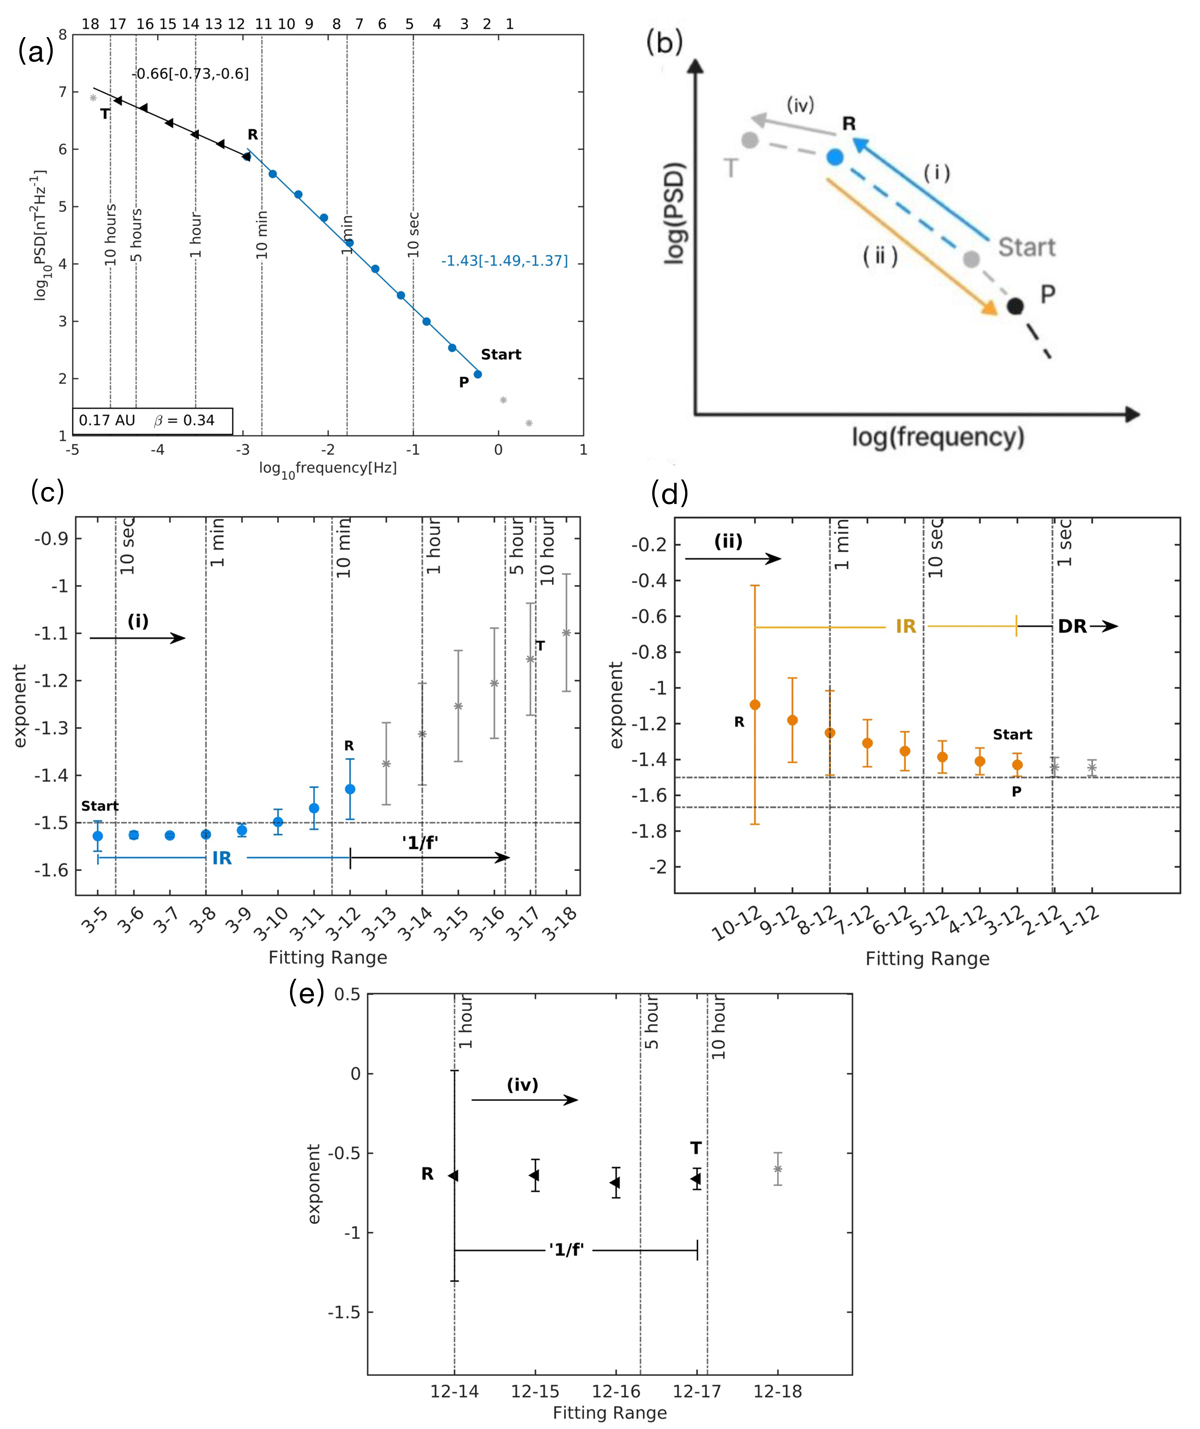
Fig. 6.
Download original image
Fit of a single gradient to the full IR of the data in Fig. 4 (counterpart to Figs. 5 and 3). This fitting approach results in IK scaling with an acceptable uncertainty (shown in blue). The wavelet points in the IR are denoted by blue circles, while black triangles represent those in the ‘1/f’ range.
Current usage metrics show cumulative count of Article Views (full-text article views including HTML views, PDF and ePub downloads, according to the available data) and Abstracts Views on Vision4Press platform.
Data correspond to usage on the plateform after 2015. The current usage metrics is available 48-96 hours after online publication and is updated daily on week days.
Initial download of the metrics may take a while.