Fig. 5.
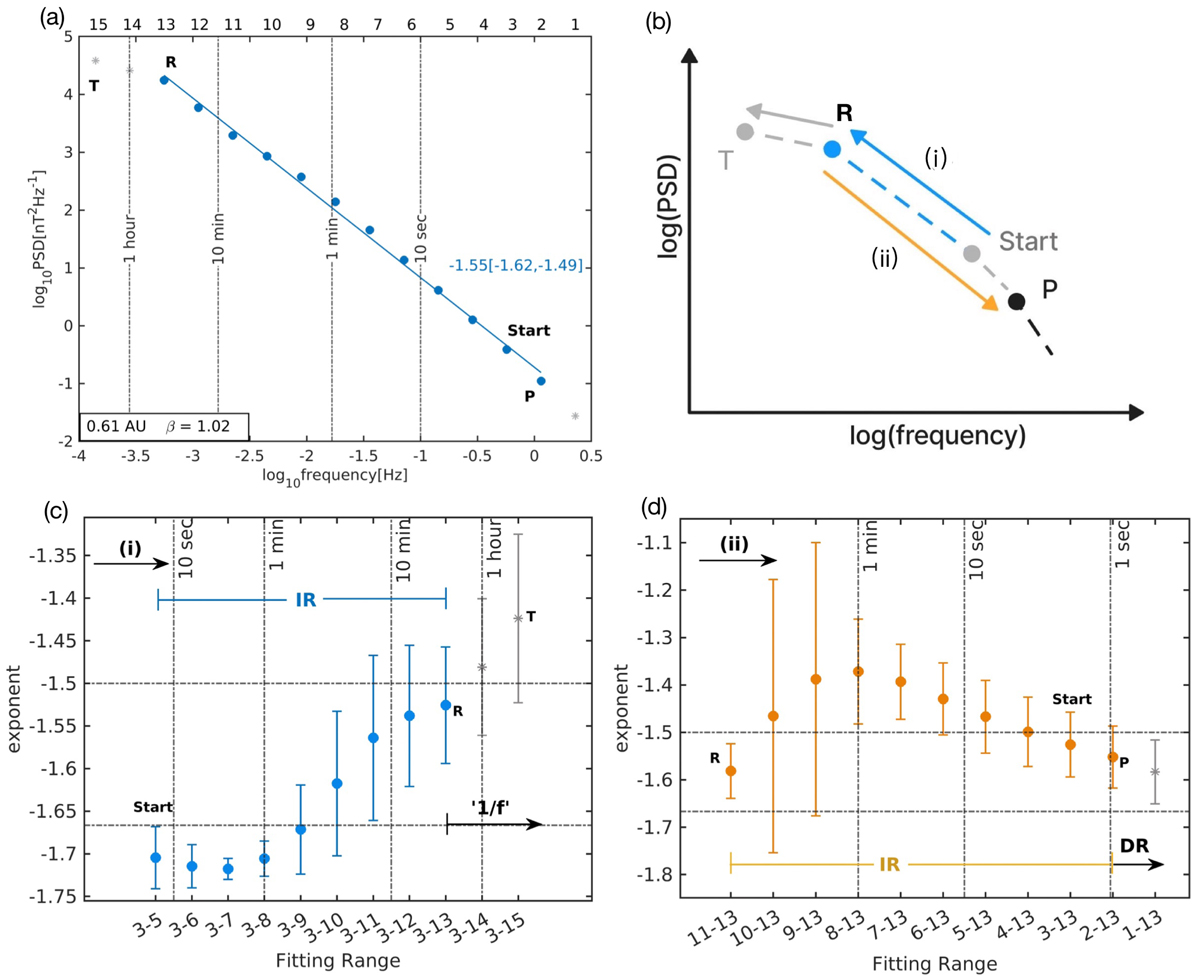
Download original image
Fit of a single gradient to the full IR of the data in Fig. 3. This fitting approach results in IK scaling within an acceptable uncertainty (shown in blue). The wavelet points in the IR are denoted by blue circles. (a): Log-log plot of PSD versus frequency. The plotted points result from a Haar wavelet analysis of the dataset. (b): Procedural diagram for panels c and d, used to identify the breakpoints between the three scaling ranges, together with their best-fit gradients. Breakpoints at the point labelled R (between IR gradient –1.55 and ‘1/f’ range; the latter terminates at the point labelled T) were identified from the CI of the exponent using the method outlined in Sect. 2.2 and are displayed in panels c and d. (c): Spectral exponent and its CI on the blue pathway labelled (i) beginning at Start and ending at R in the procedural diagram above. (d): Pathway (ii) descending from point 13 (yellow). It has the minimum CI when it encompasses points down to point 2.
Current usage metrics show cumulative count of Article Views (full-text article views including HTML views, PDF and ePub downloads, according to the available data) and Abstracts Views on Vision4Press platform.
Data correspond to usage on the plateform after 2015. The current usage metrics is available 48-96 hours after online publication and is updated daily on week days.
Initial download of the metrics may take a while.