Fig. 3.
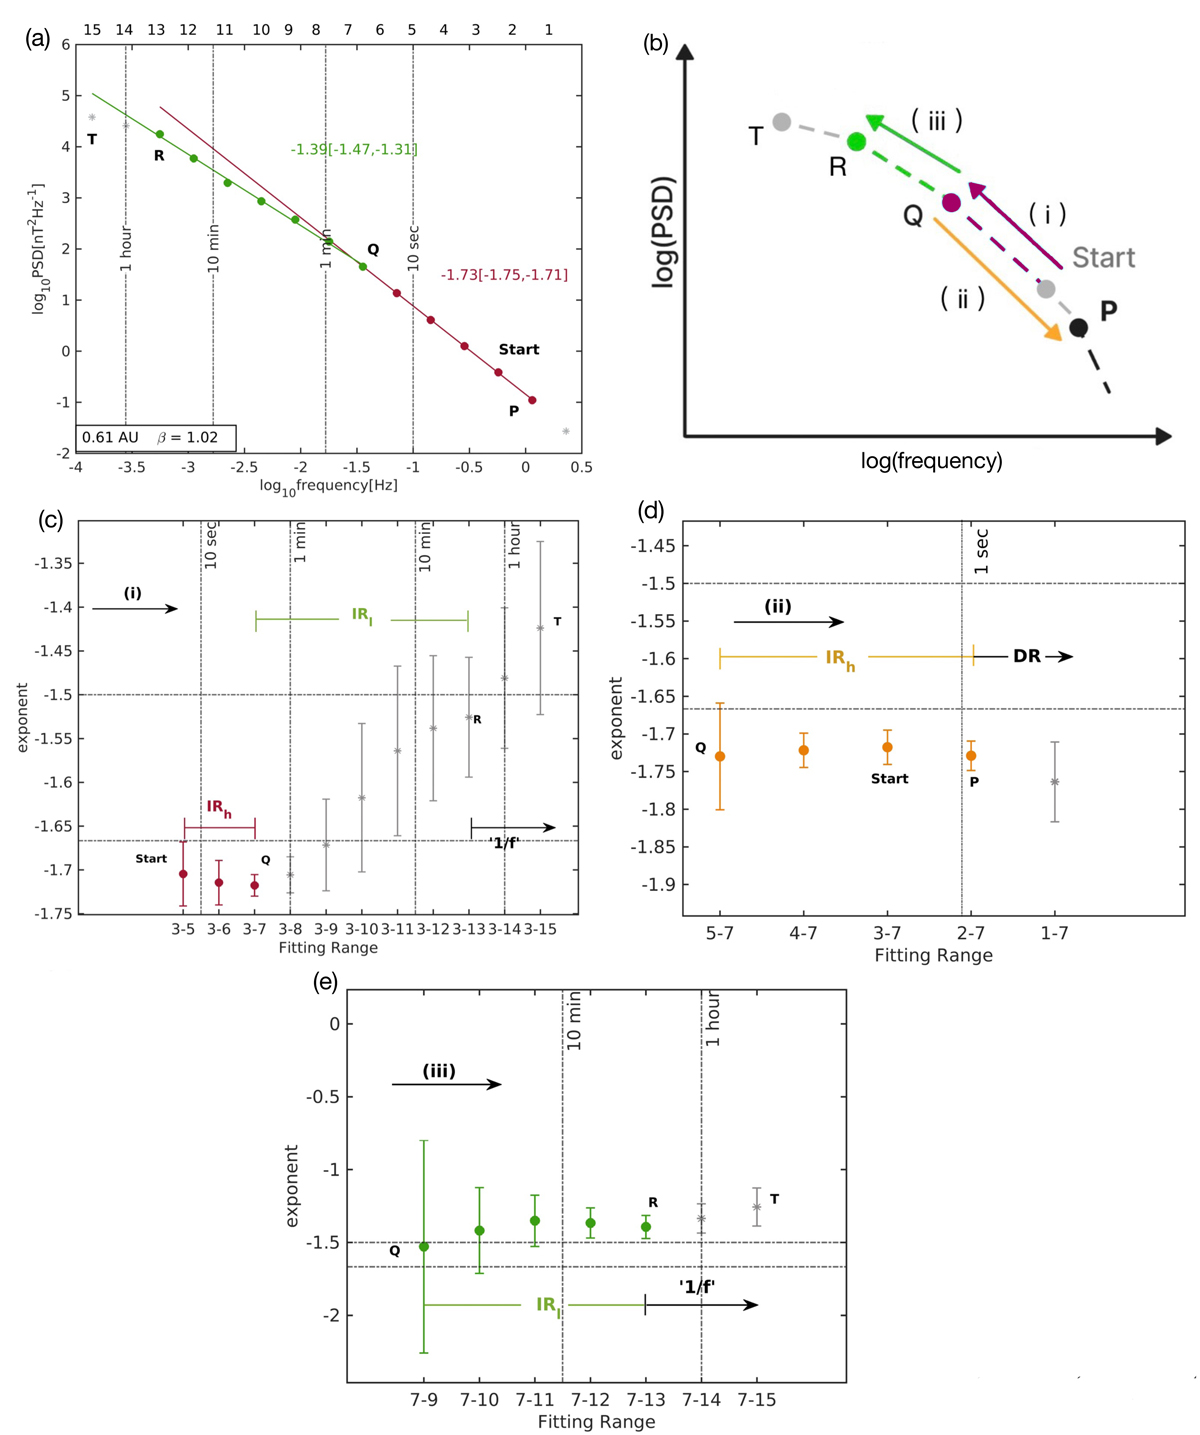
Download original image
Example of a type III spectrum that shows two ranges of scaling within the IR: close to Kolmogorov scaling at higher frequencies (pink circles in the top panel; the asterisks lie outside this range) and a shallower range (at lower frequencies; i.e. the green circles in panel a). The interval is for PSP/FIELDS measurements of the full trace of power spectral tensor taken over a 5 h interval at 0.61 AU with local plasma β = 1.02. (a): Log-log plot of PSD versus frequency. The plotted points result from a Haar wavelet analysis of the dataset. (b): Procedural diagram for panels c to e used to identify the breakpoints between the three scaling ranges, together with their best-fit gradients. Breakpoints at the point labelled Q (between gradients –1.73 and –1.39) and at the point labelled R (between IR gradient –1.39 and ‘1/f’ range; the latter terminates at the point labelled T) were identified from the CI of the exponent using the method outlined in Sect. 2.2, the exponents and CI are displayed in panels c to e. (c): Minimum exponent CI located at the point labelled Q for pathway (i) extending from point 3 upwards (pink). The continuation of the pathway (i) beyond point 7 suggests a second breakpoint at point 13, where the CI suddenly increases. (d): Pathway (ii) descending from point 7 (yellow). It has the minimum CI when it encompasses points down to point 2. (e): Exponent and CI for pathway (iii), in green. This confirms the breakpoint at the point labelled R.
Current usage metrics show cumulative count of Article Views (full-text article views including HTML views, PDF and ePub downloads, according to the available data) and Abstracts Views on Vision4Press platform.
Data correspond to usage on the plateform after 2015. The current usage metrics is available 48-96 hours after online publication and is updated daily on week days.
Initial download of the metrics may take a while.