Fig. 2.
Download original image
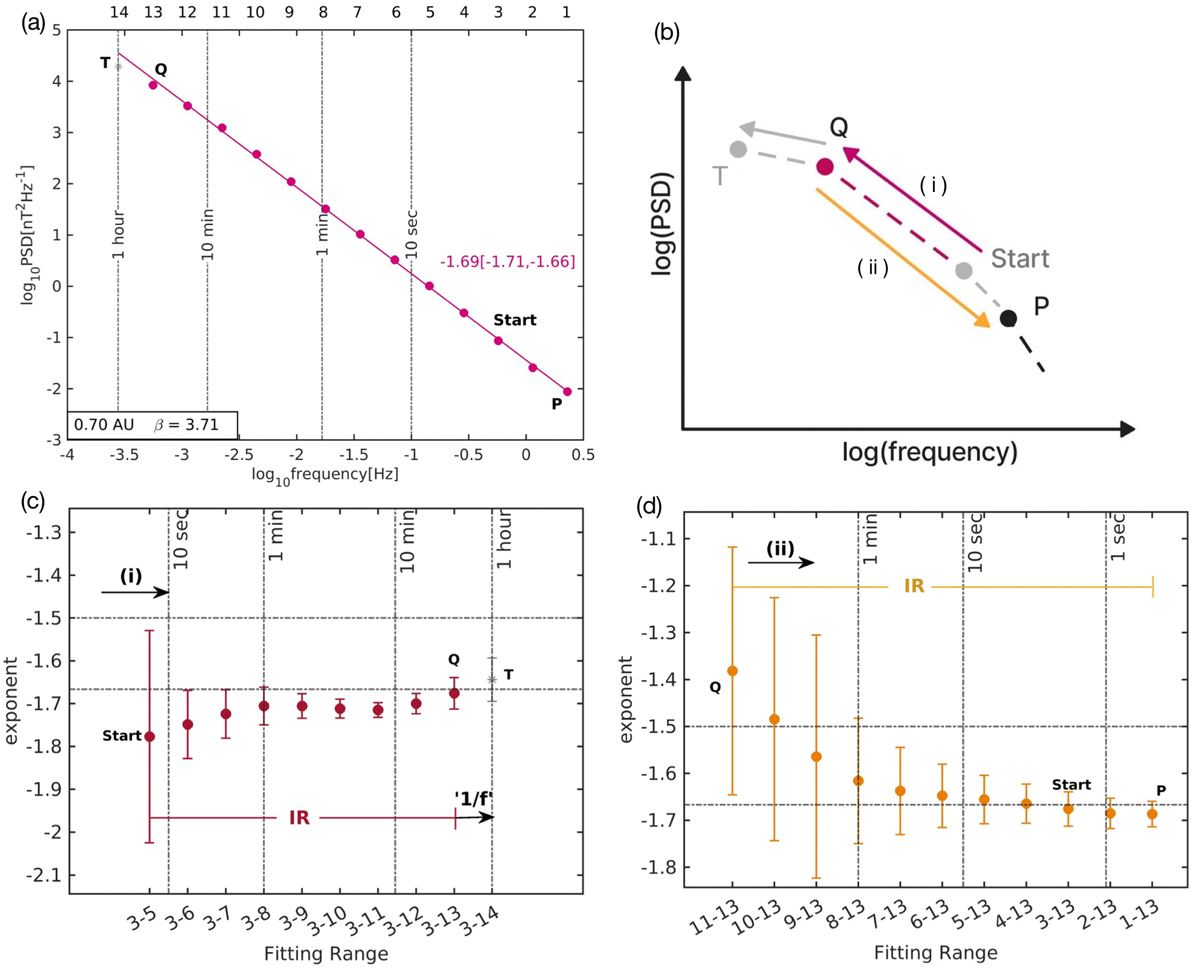
Example of a type IV spectrum that shows a single range of scaling close to Kolmogorov across the full IR for PSP/FIELDS measurements of the full trace of power spectral tensor, taken over a 3 h interval at 0.70 AU with local plasma β = 3.71. (a): Log-log plot of PSD versus frequency. Plotted points result from a Haar wavelet analysis of the dataset; they are marked as pink circles in the IR identified here and as a grey asterisk outside it. (b): Procedural diagram for the two adjacent scatter plots used to identify the IR and its single best-fit gradient. Breakpoints at the upper and lower end of the IR were identified by locating sudden increases in the CI of the exponent using the method outlined in Sect. 2.2, as shown in panels c and d. (c): Spectral exponent and its CI on the pink pathway labelled (i) beginning at Start and ending at Q in the procedural diagram above. (d): Same as panel c, but for the yellow pathway labelled (ii) beginning at Q and descending to the first pink circle, labelled P.
Current usage metrics show cumulative count of Article Views (full-text article views including HTML views, PDF and ePub downloads, according to the available data) and Abstracts Views on Vision4Press platform.
Data correspond to usage on the plateform after 2015. The current usage metrics is available 48-96 hours after online publication and is updated daily on week days.
Initial download of the metrics may take a while.