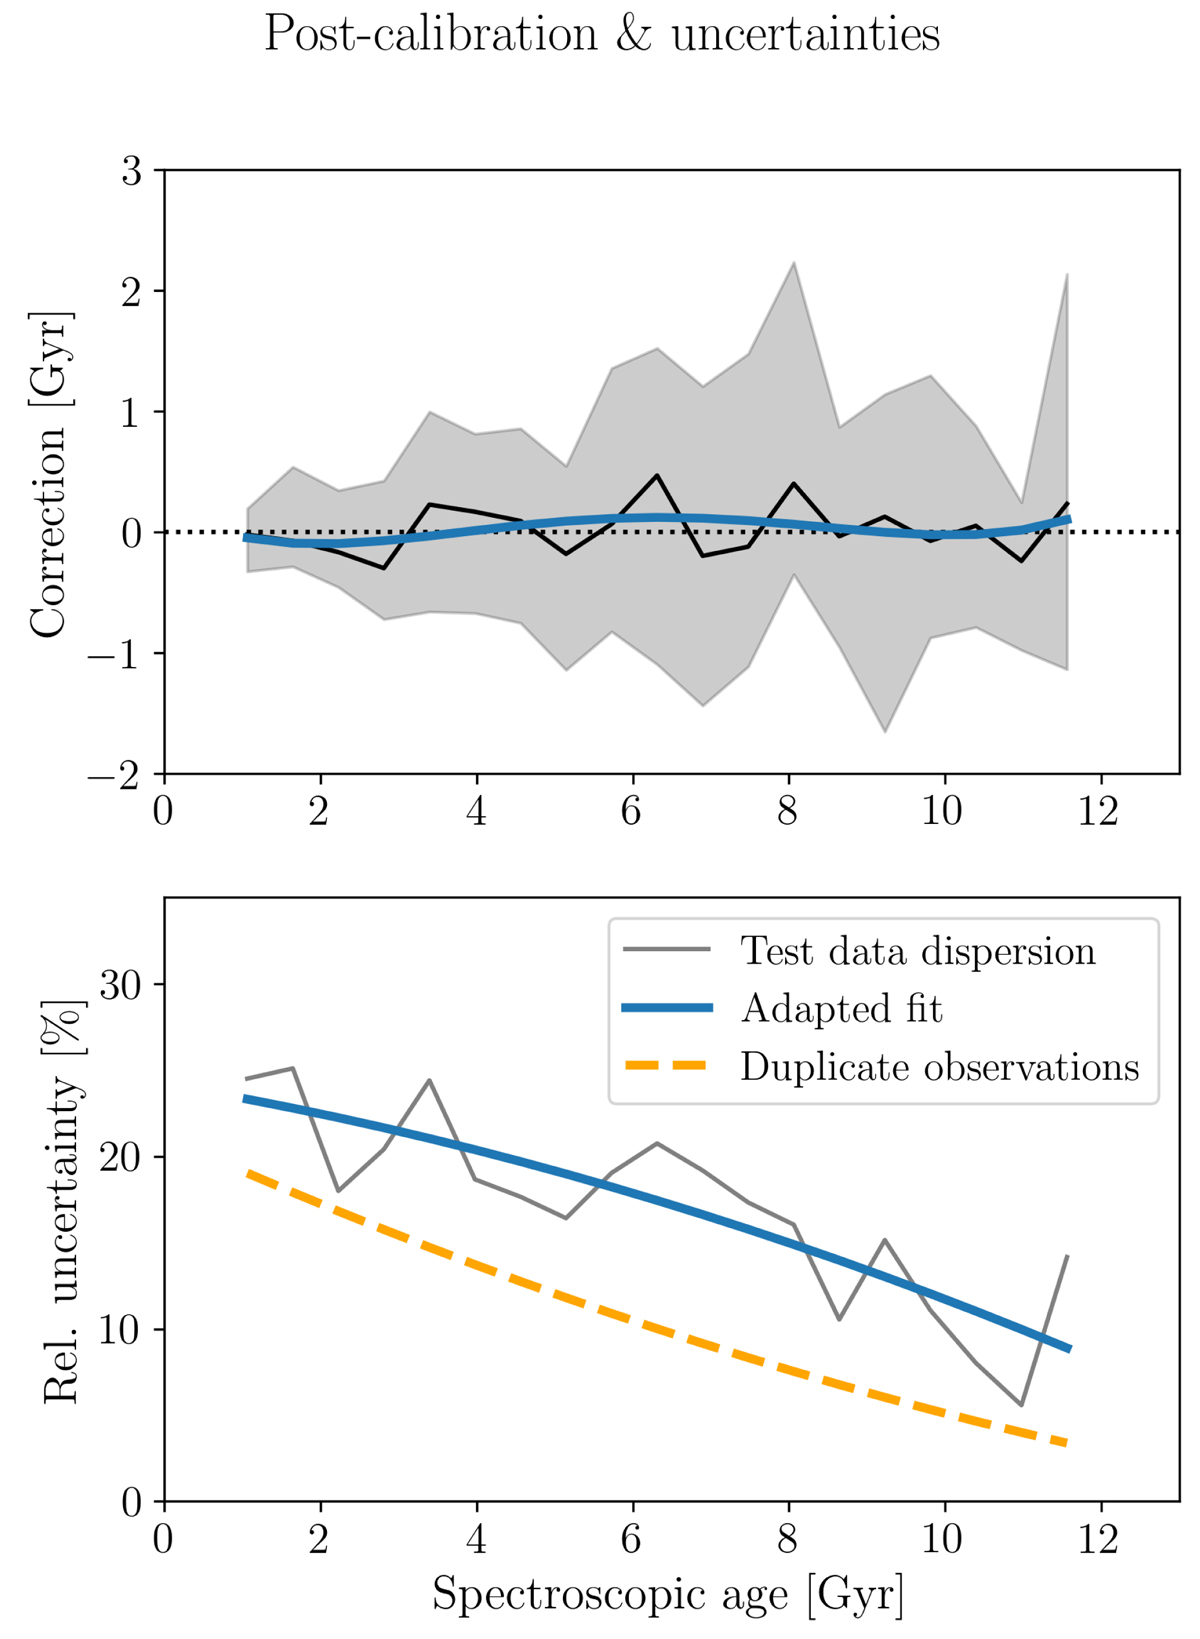
Fig. 4.
Download original image
Possible a-posteriori calibration of the age estimates (top panel) and estimation of the internal statistical uncertainties (bottom panel) using the same data as in Fig. 2. The top panel shows the median age bias (test seismic age − spectroscopic age) as a function of the spectroscopic age. The bottom panel shows the relative age error (width of the grey distribution in the top panel normalised by the spectroscopic age). As a sanity check, the orange dotted line in the bottom panel shows the median relative age dispersion among duplicate APOGEE observations. In both panels, we also show the simple polynomial fits used to characterise the bias and 1σ age uncertainty in our catalogue.
Current usage metrics show cumulative count of Article Views (full-text article views including HTML views, PDF and ePub downloads, according to the available data) and Abstracts Views on Vision4Press platform.
Data correspond to usage on the plateform after 2015. The current usage metrics is available 48-96 hours after online publication and is updated daily on week days.
Initial download of the metrics may take a while.