Fig. 2.
Download original image
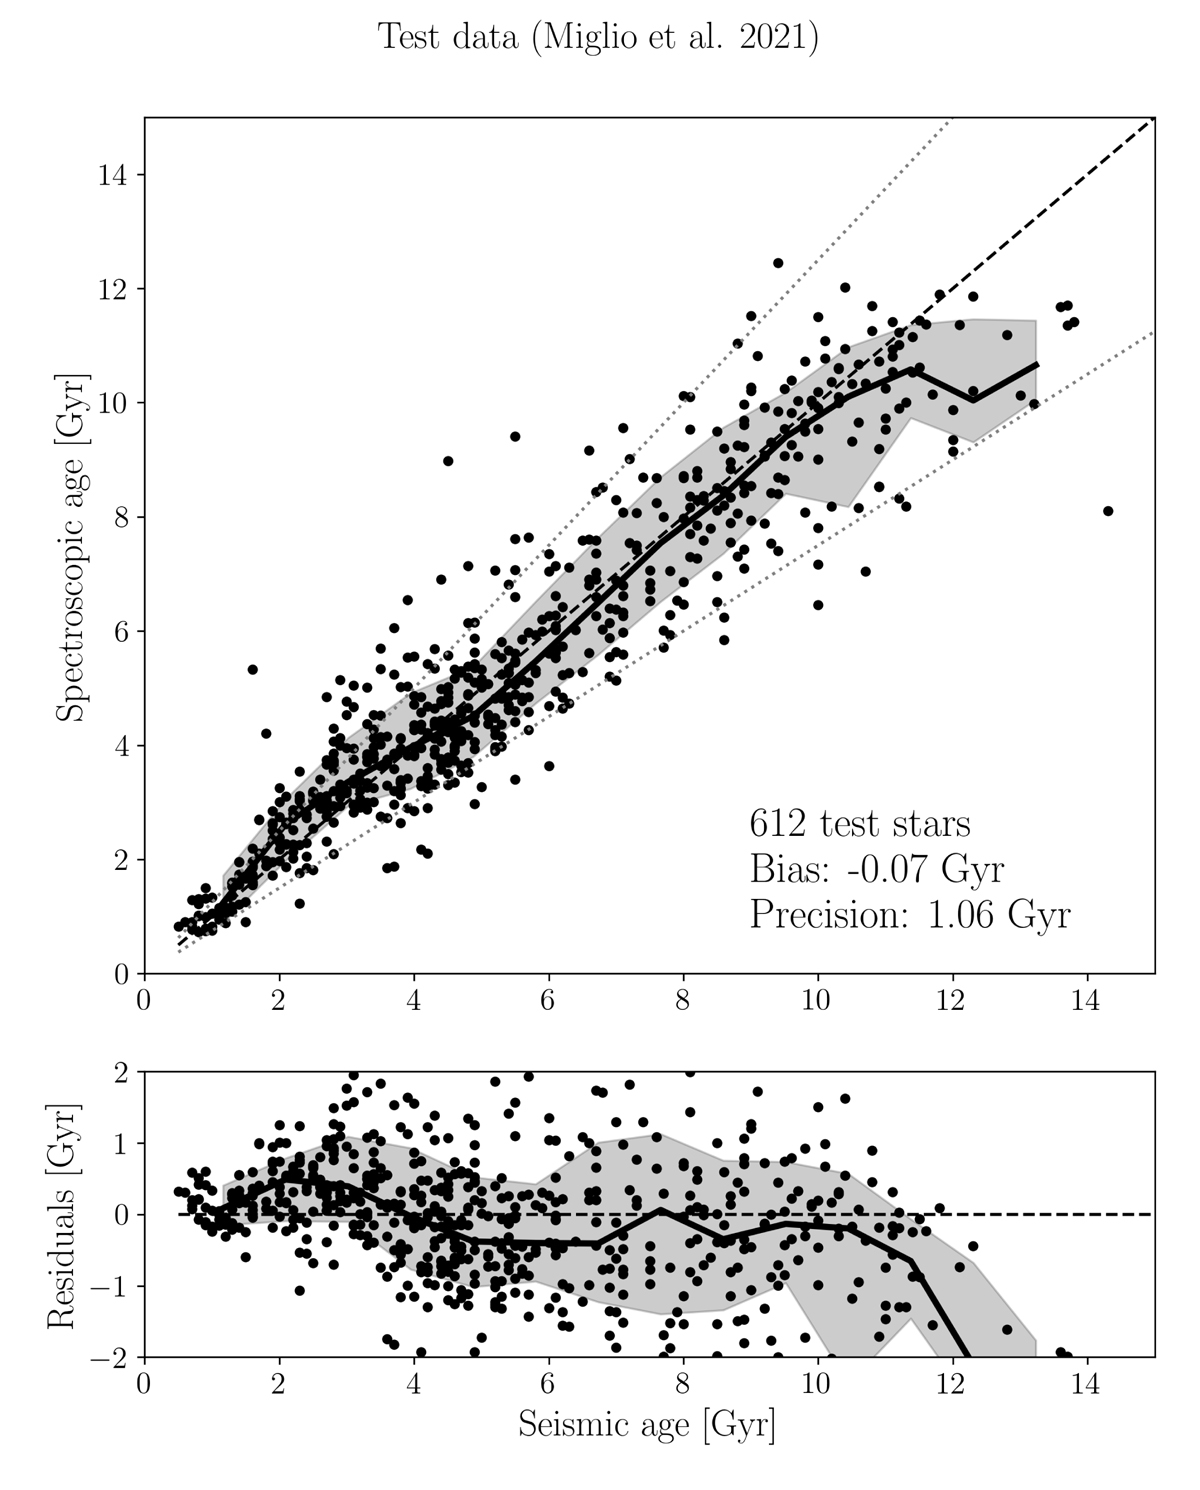
Performance of the XGBoost chemical age estimator for the unseen test data. Top panel: spectroscopic age vs. asteroseismic age (from Miglio et al. 2021), using our default model. The solid black line and the shaded areas delineate the median trend and 1σ quantiles. The dashed line delineates the identity line, while the grey dotted lines correspond to ±25% deviation. Bottom panel: residuals (spectroscopic – seismic age), showing that our model typically provides reliable ages (with systematic residuals within ∼0.5 Gyr for stars with ages ≤11 Gyr).
Current usage metrics show cumulative count of Article Views (full-text article views including HTML views, PDF and ePub downloads, according to the available data) and Abstracts Views on Vision4Press platform.
Data correspond to usage on the plateform after 2015. The current usage metrics is available 48-96 hours after online publication and is updated daily on week days.
Initial download of the metrics may take a while.