Fig. D.1.
Download original image
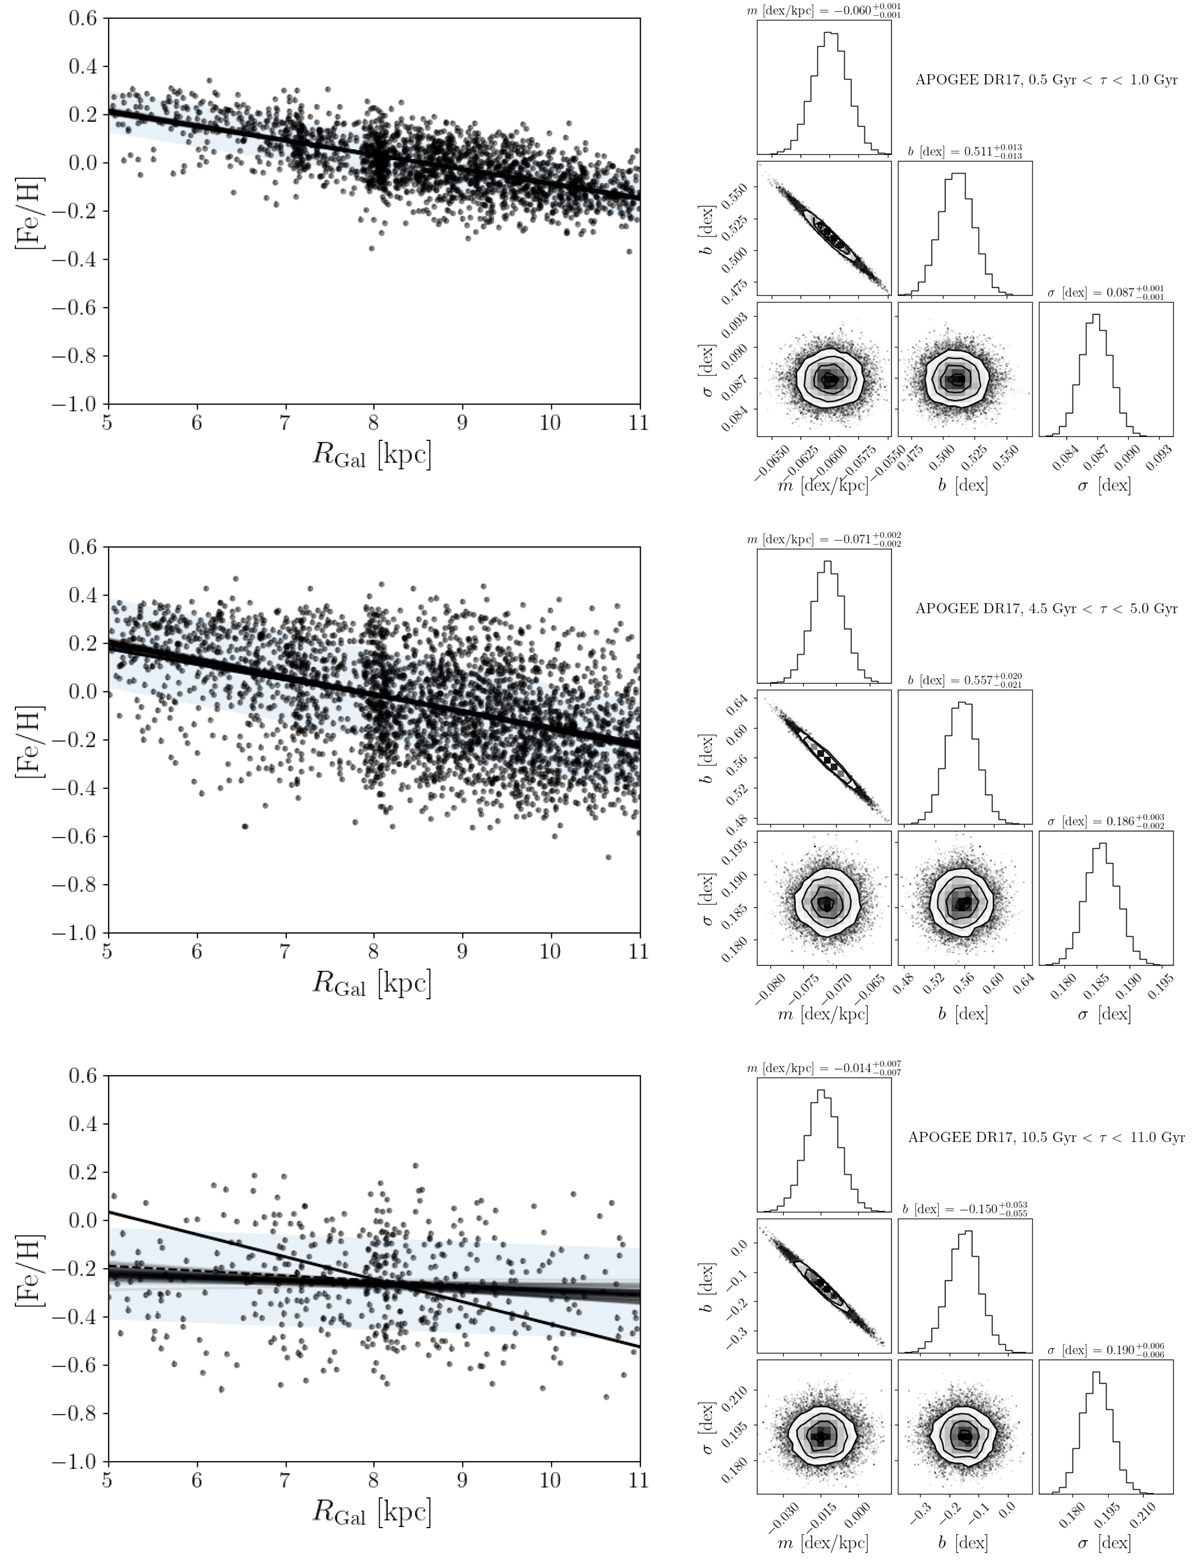
Examples of the fits to the [Fe/H] vs. RGal distributions for three age bins (from top to bottom: 0.5-1 Gyr, 4.5-5 Gyr, 10.5-11 Gyr). Left panels: distribution of the red-giant stars in each age bin. The thick black line shows the result of a naïve least-squares linear fit. The thin grey lines show 30 realisations drawn from the linear gradient + intrinsic scatter posterior, while the shaded band corresponds the 1σ dispersion around the gradient. Right panels: posterior distributions of the fit parameters (m = ∂[Fe/H]/∂R, b (intercept at R = 0), and σ (intrinsic [Fe/H] dispersion).
Current usage metrics show cumulative count of Article Views (full-text article views including HTML views, PDF and ePub downloads, according to the available data) and Abstracts Views on Vision4Press platform.
Data correspond to usage on the plateform after 2015. The current usage metrics is available 48-96 hours after online publication and is updated daily on week days.
Initial download of the metrics may take a while.