Open Access
Fig. D.1
Download original image
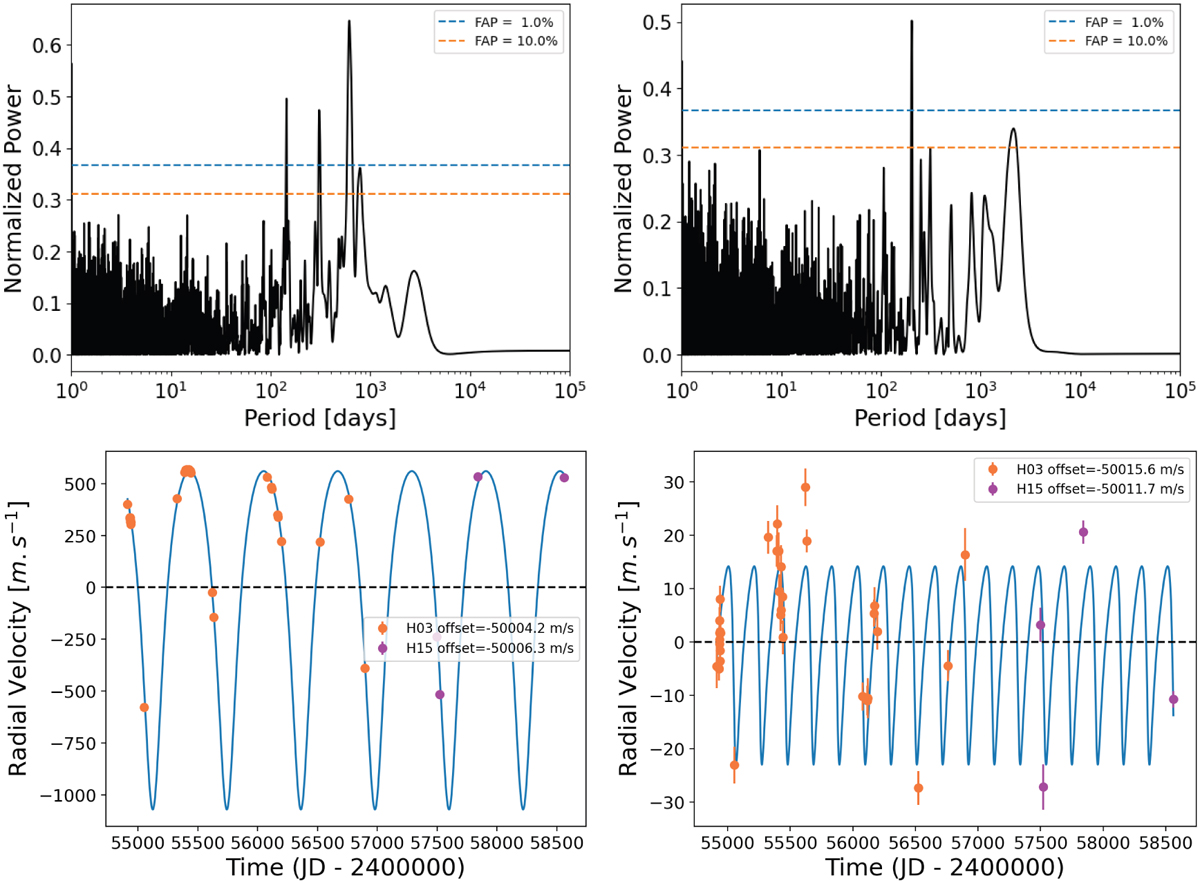
Periodograms of GJ660.1. Top left: Periodogram of the GJ660.1 A RV measurements. Top right: Periodogram of the RV residuals. Bottom left: Best fit of the GJ660.1 A RV measurements obtained with DPASS. Bottom left: Best fit of the GJ660.1 A RV measurements, corrected for the signal of GJ660.1 C, obtained with DPASS.
Current usage metrics show cumulative count of Article Views (full-text article views including HTML views, PDF and ePub downloads, according to the available data) and Abstracts Views on Vision4Press platform.
Data correspond to usage on the plateform after 2015. The current usage metrics is available 48-96 hours after online publication and is updated daily on week days.
Initial download of the metrics may take a while.