Fig. 10
Download original image
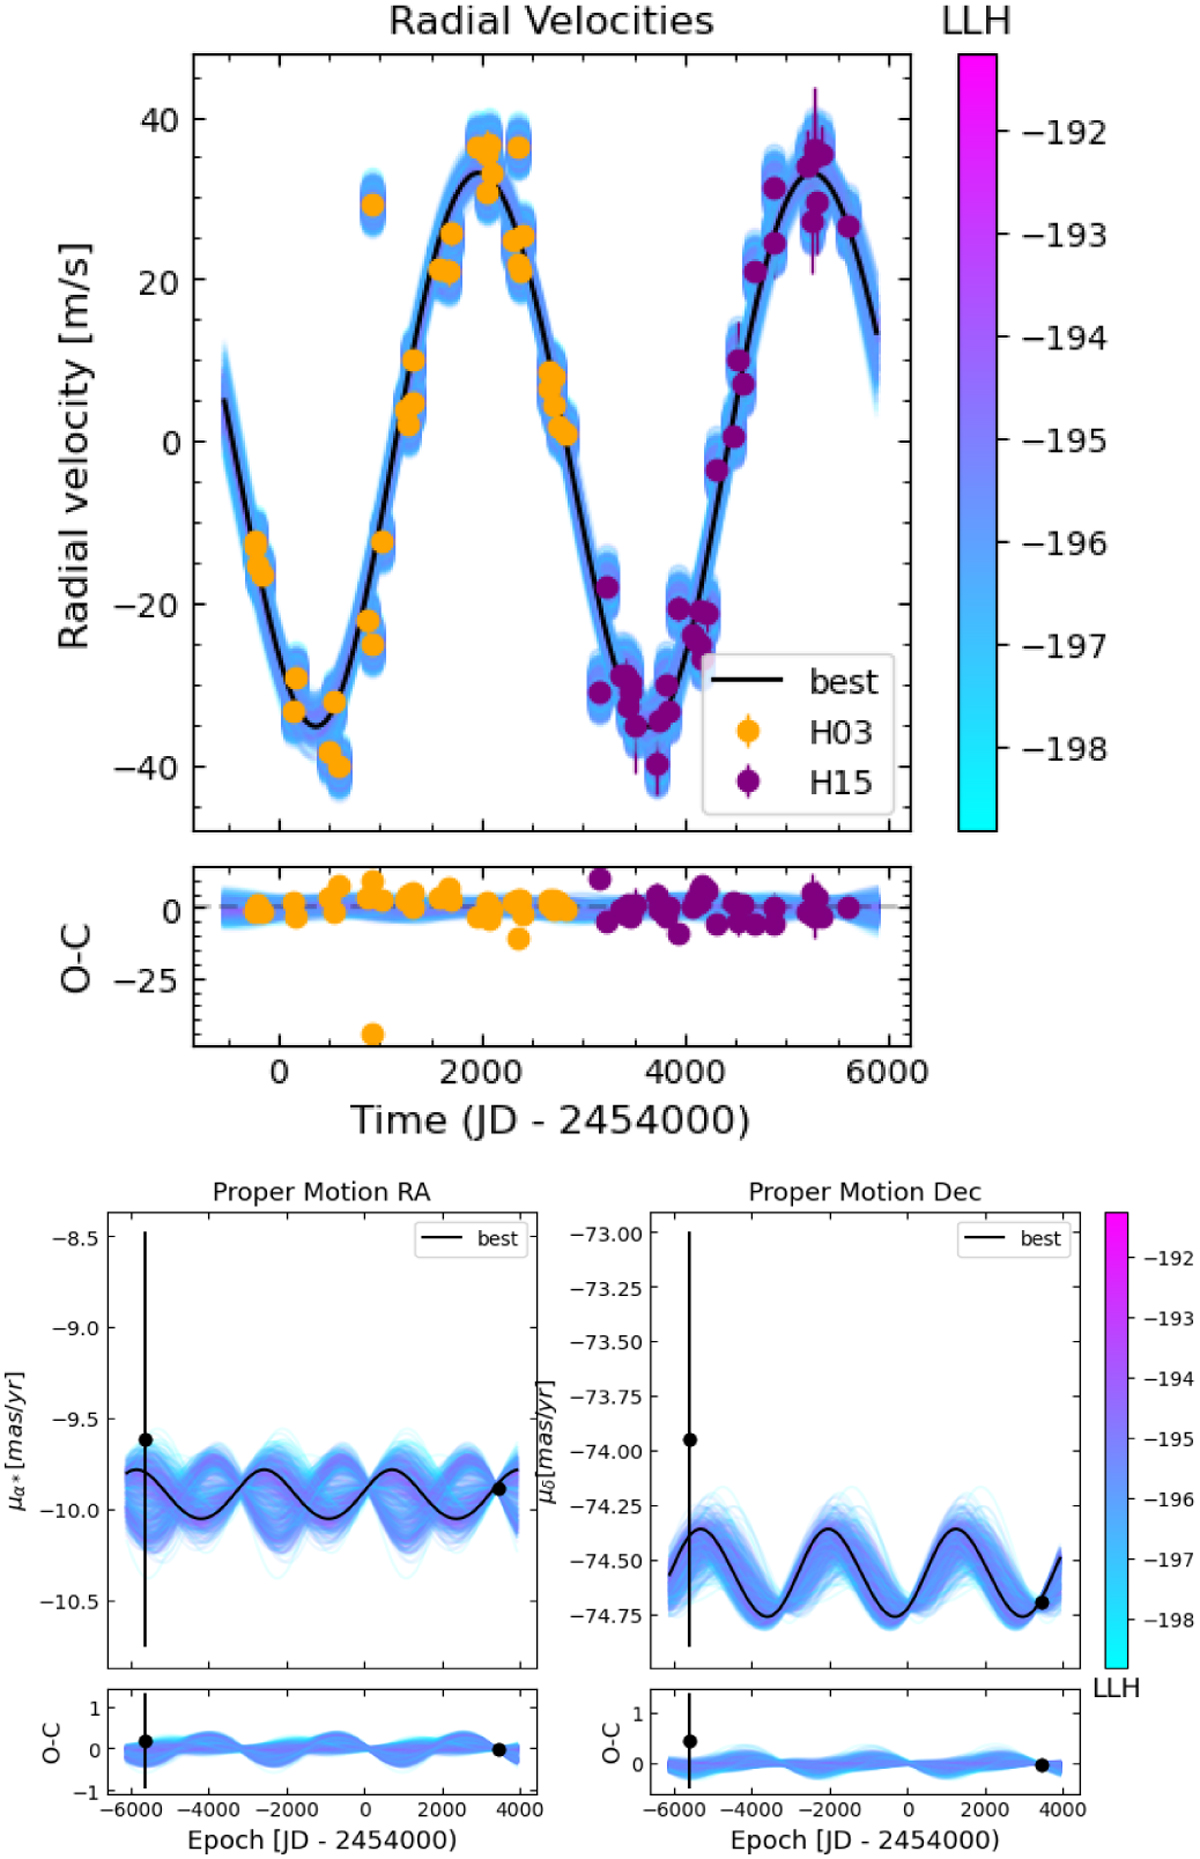
Fit of the orbit of HIP 54597. Top: fit of the HIP 54597 RV measurements. Bottom: fit of the HIP 54597 astrometric acceleration in right ascension (left) and declination (right). The black points correspond to the HIPPARCOS and Gaia EDR3 proper motion measurements. In each plot, the black curve corresponds to the best fit. The color bar indicates the log-likelihood corresponding to the different fits plotted.
Current usage metrics show cumulative count of Article Views (full-text article views including HTML views, PDF and ePub downloads, according to the available data) and Abstracts Views on Vision4Press platform.
Data correspond to usage on the plateform after 2015. The current usage metrics is available 48-96 hours after online publication and is updated daily on week days.
Initial download of the metrics may take a while.