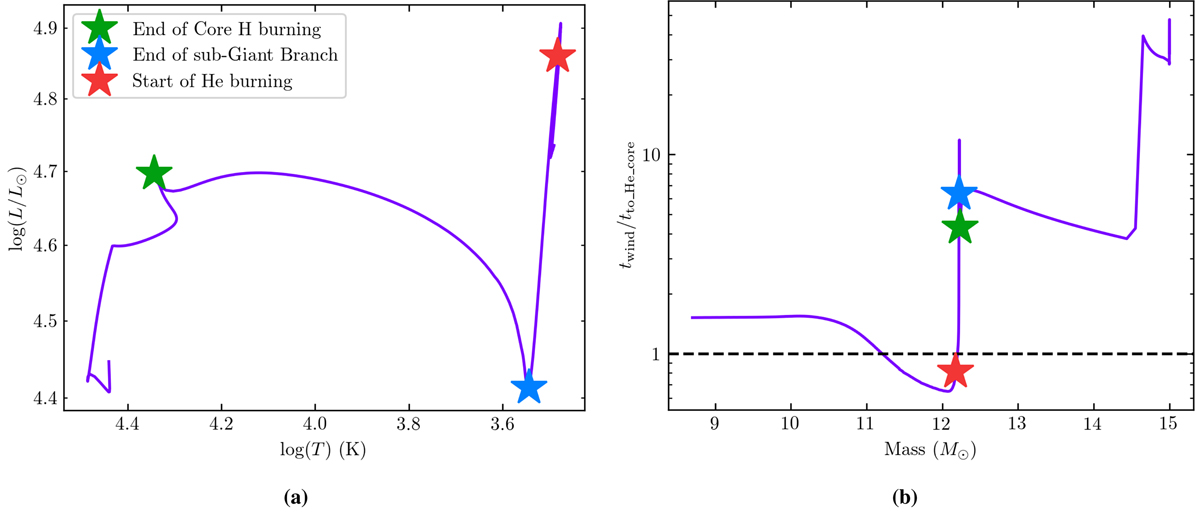
Fig. 2.
Download original image
Evolutionary stages of a 15 M⊙ star with 5 Z⊙ modeled with MESA. Panel a): H–R diagram, with key evolutionary points marked with colored stars. Panel b): wind-lifetime ratio vs. mass (one of the tracks from Fig. 1), with the same evolutionary points marked. For this example system (and indeed all other systems), the steepest wind-lifetime ratio decrease occurs when the star halts core H burning and begins He burning. We note that the He burning shown here (marked with the red star) represents the first instance of a decrease in total helium mass, and precedes the core He burning defined in Hurley et al. (2000).
Current usage metrics show cumulative count of Article Views (full-text article views including HTML views, PDF and ePub downloads, according to the available data) and Abstracts Views on Vision4Press platform.
Data correspond to usage on the plateform after 2015. The current usage metrics is available 48-96 hours after online publication and is updated daily on week days.
Initial download of the metrics may take a while.