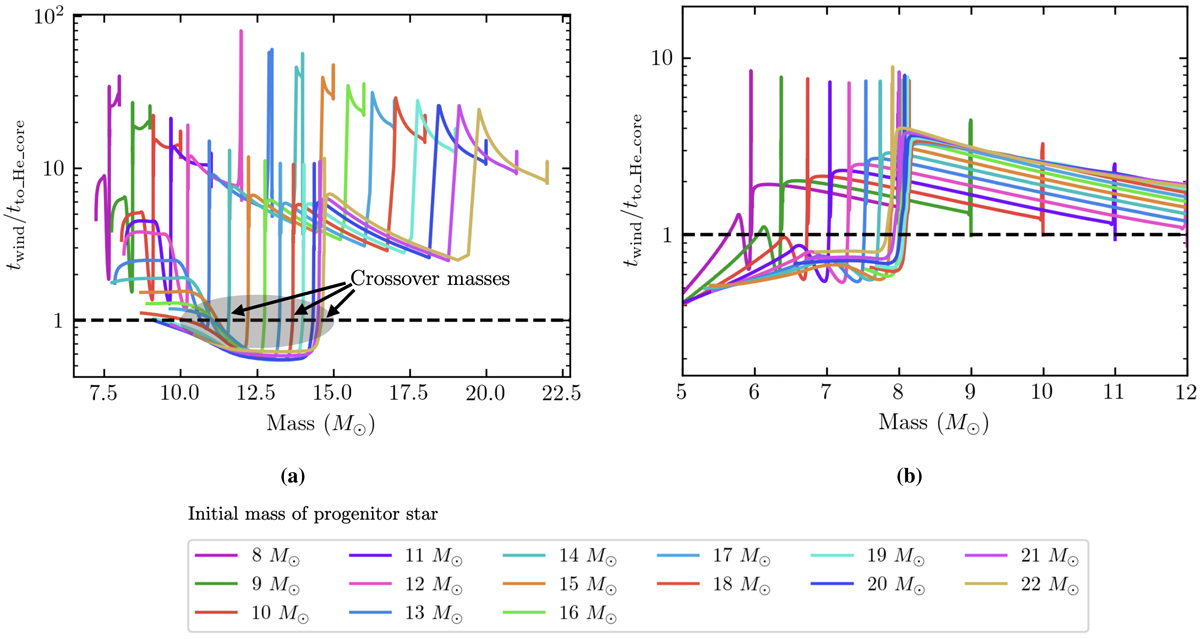
Fig. 1.
Download original image
Ratio between mass-loss timescale and lifetime of stars modeled with MESA. Panel a): metallicity = 5 Z⊙. Panel b): metallicity = 9 Z⊙. The horizontal axis shows the total stellar mass, and the vertical axis shows the timescale ratio (see text for more details). The colored tracks show the evolution of the mass-loss timescale for different initial masses (see legend). Stellar evolution starts on the right of the plot and progresses toward the left as mass is lost. The black dashed line is displayed for clarity and shows when the wind-lifetime ratio is equal to one. At a metallicity of 5 Z⊙ (left panel), only systems with M > 13 M⊙ have a wind-lifetime ratio that falls below unity, with varying crossover masses. The panel on the right, at 9 Z⊙, shows that all modeled systems have wind-lifetime ratios that cross below one. The gray shaded oval and the black arrows in the left panel represent the crossover of the wind-lifetime ratio below unity and defines the crossover mass (see Sect. 3 for more details).
Current usage metrics show cumulative count of Article Views (full-text article views including HTML views, PDF and ePub downloads, according to the available data) and Abstracts Views on Vision4Press platform.
Data correspond to usage on the plateform after 2015. The current usage metrics is available 48-96 hours after online publication and is updated daily on week days.
Initial download of the metrics may take a while.