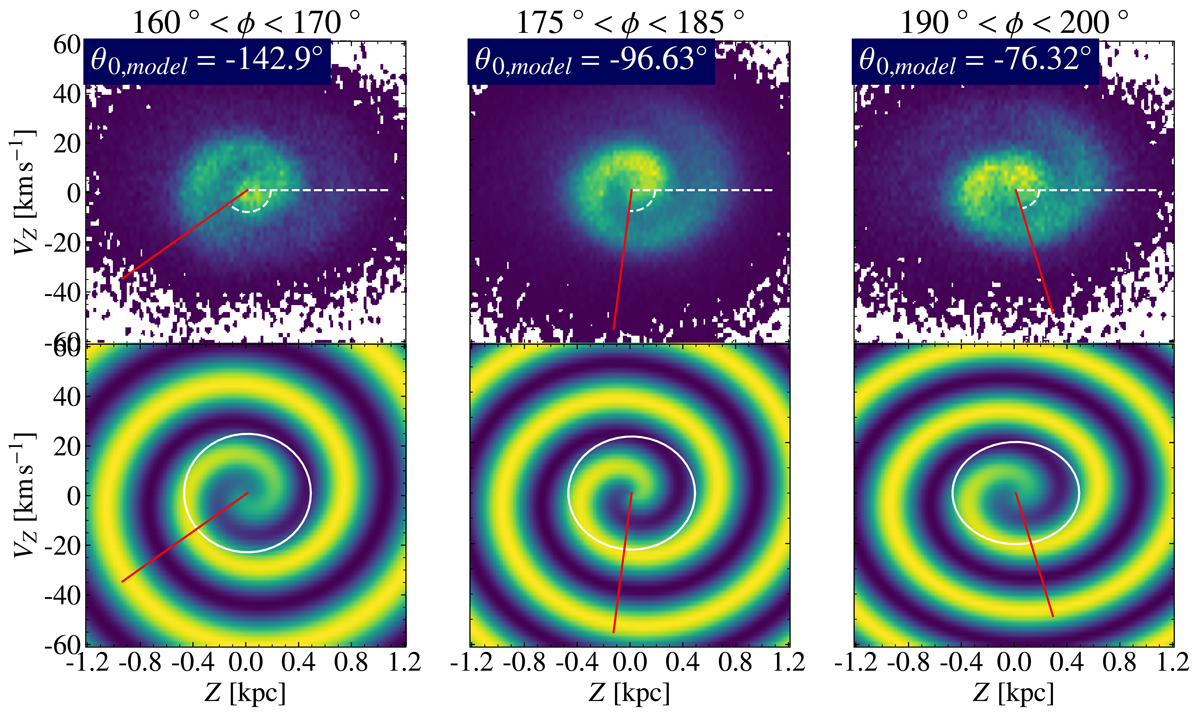
Fig. 8.
Download original image
Demonstration of the rotation of the phase spiral with visualisation of how the model found the angles. Upper row: phase spiral at low, medium, and high Galactic azimuth (ϕ) with the angle θ 0, model marked with a red line and θ 0, model = 0 marked with a white dashed line. Lower row: corresponding spiral perturbations fitted to the data with θ 0, model marked with a red line and the measurement distance for θ 0, model marked with a white ring.
Current usage metrics show cumulative count of Article Views (full-text article views including HTML views, PDF and ePub downloads, according to the available data) and Abstracts Views on Vision4Press platform.
Data correspond to usage on the plateform after 2015. The current usage metrics is available 48-96 hours after online publication and is updated daily on week days.
Initial download of the metrics may take a while.