Fig. 7.

Download original image
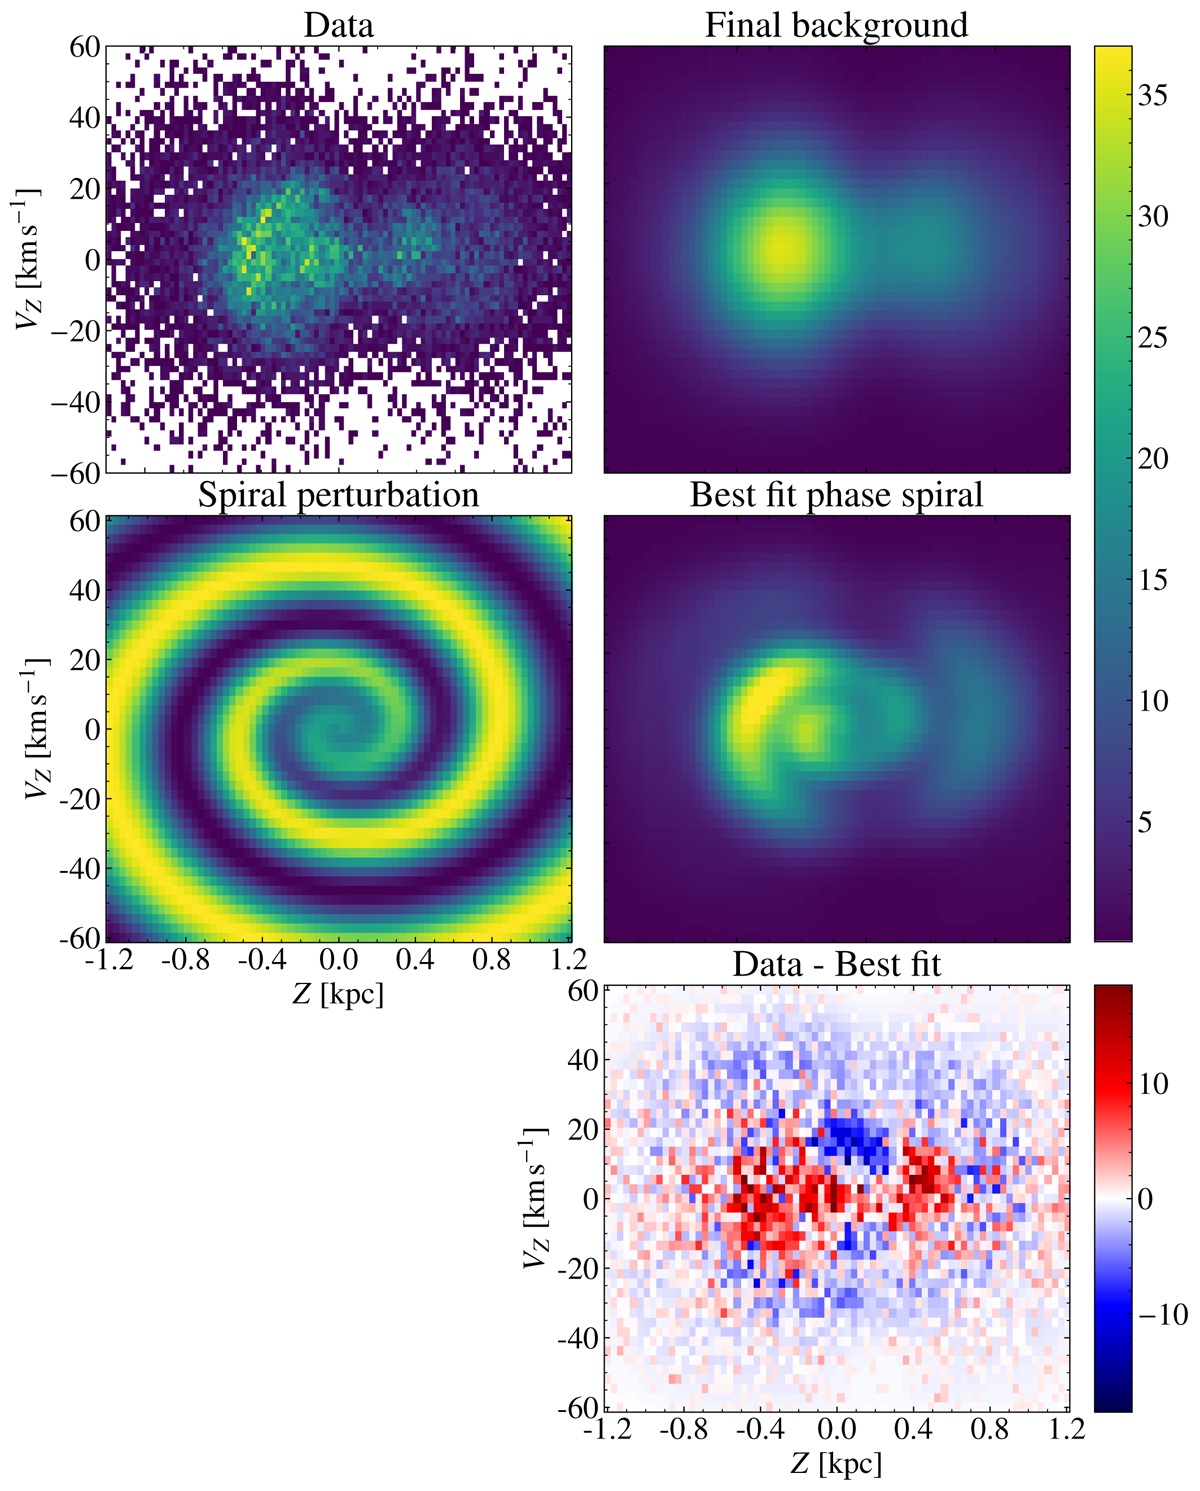
Example of a selection of stars near the edge of our considered area, containing only about 22 000 stars. The sample contains stars with 8 < R/kpc < 12 and 150° < ϕ < 155°. Upper left: phase plane showing strong extinction by dust. Upper right: background produced by the model. Lower left: spiral perturbation produced by the model (this panel does not share the colour bar with the rest). Lower right: best fit. Bottom: residuals computed as Data – Best fit. We can see that even without a clear spiral pattern in the data, the model still produces a convincing spiral and fit.
Current usage metrics show cumulative count of Article Views (full-text article views including HTML views, PDF and ePub downloads, according to the available data) and Abstracts Views on Vision4Press platform.
Data correspond to usage on the plateform after 2015. The current usage metrics is available 48-96 hours after online publication and is updated daily on week days.
Initial download of the metrics may take a while.


