Fig. A.1.
Download original image
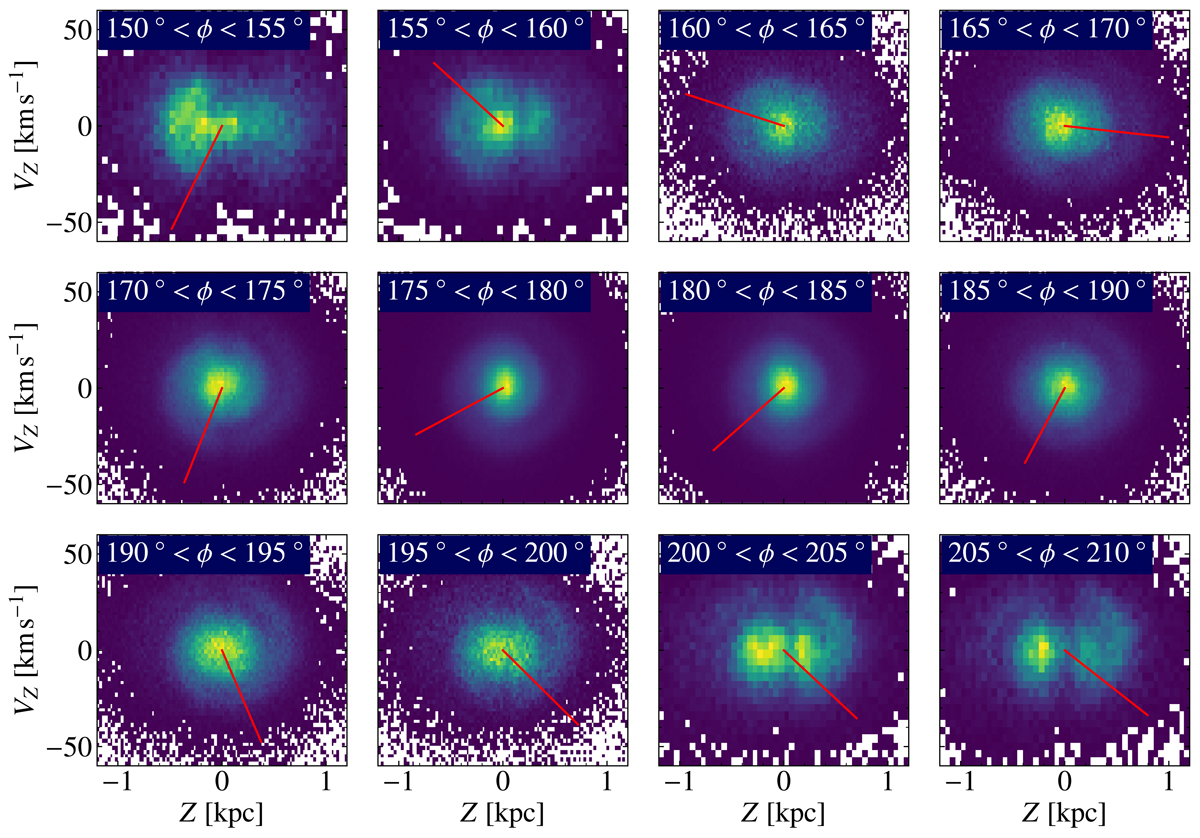
Phase spirals and fitted spiral perturbations at different values for Galactic azimuth (ϕ) in the 2000 < LZ/ kpc km s−1 < 2200 range. The measured angle of the phase spiral is marked with a red line. The azimuthal range of the stars is marked with text in the right panels. This figure shows how we can use the model to determine the angle of the phase spiral, even in regions where the data are of lower quality due to extinction by dust.
Current usage metrics show cumulative count of Article Views (full-text article views including HTML views, PDF and ePub downloads, according to the available data) and Abstracts Views on Vision4Press platform.
Data correspond to usage on the plateform after 2015. The current usage metrics is available 48-96 hours after online publication and is updated daily on week days.
Initial download of the metrics may take a while.